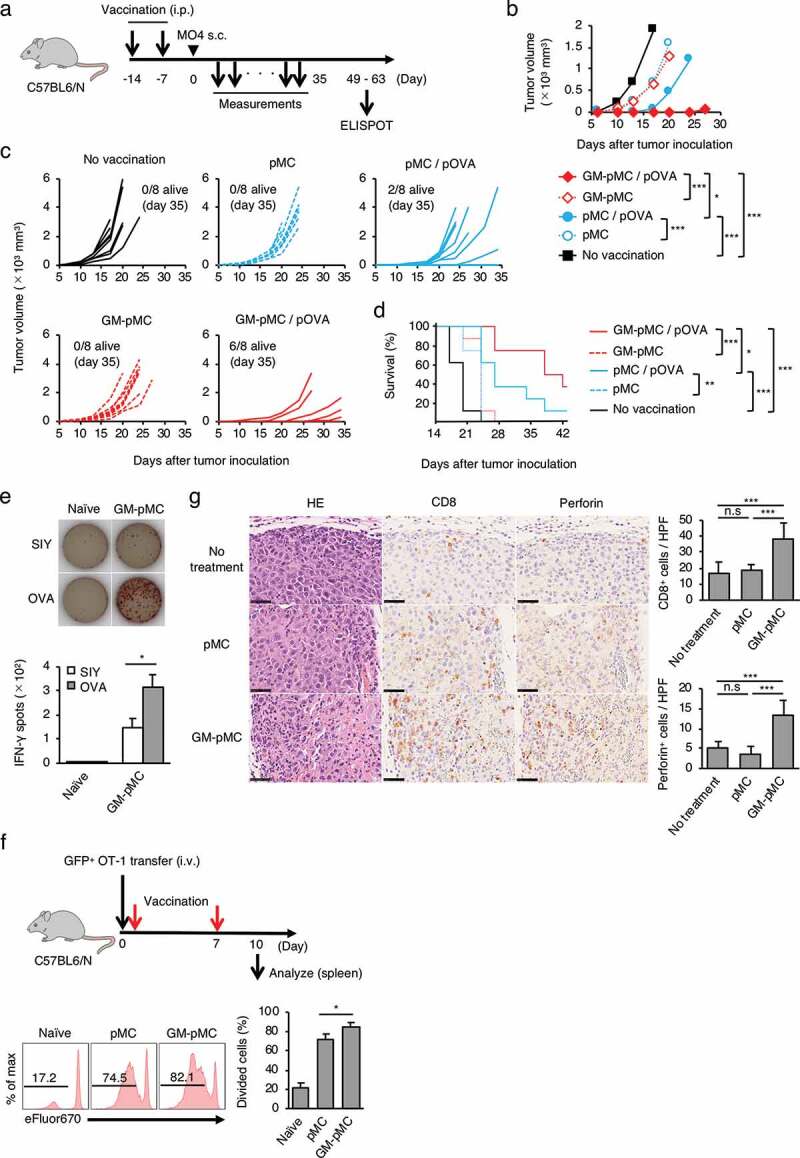
Figure 4.

GM-pMCs suppress tumor growth via induction of tumor-reactive CD8+ T cells.
(a) Schematic for vaccination and tumor implantation. C57BL/6 mice were i.p. vaccinated twice followed by s.c. (right flank) inoculation of MO4 tumor cells. Tumor growth and survival were monitored until the mice died or were sacrificed when the tumors exceeded 20 mm in a diameter. (b–e) C57BL/6 mice were i.p. vaccinated with the OVA257-264 peptide-loaded or the unloaded pMCs or the GM-pMCs. (b) Median tumor volume (mm3: length × width2). (c) Tumor growth of individual mice. (d) Kaplan-Meier survival curves. (b–d) Data shown are representative of two independent experiments. (n = 8 mice). (e) IFN-γ ELOSPOT assay ex vivo on day 56 after inoculation. Spleen CD8+ T cells from mice with complete tumor rejection by the OVA257-264 peptide-loaded GM-pMC vaccine or naïve mice were stimulated with the OVA257-264 peptide- or control SIY peptide (SIYRYYGL)-loaded, irradiated RMA-S for 18 h. The number of IFN-γ-producing cells was assessed using the ELISPOT assay. Upper panels, representative samples of each group. Bar graph (lower panel) represents the number of IFN-γ spots. Shown are the mean ± SEM of two independent experiments (n = 7). (f) C57BL/6 mice were intravenously transferred with the eFluor 670-labeled naïve GFP+ OT-1 CD8+ T cells and were left untreated or were vaccinated with the OVA257-264 peptide-loaded pMCs or the GM-pMCs on days 0 and 7 after inoculation. On day 10, GFP+ spleen cell proliferation was assessed based on eFluor 670 dilutions with flow cytometry. Upper left panel, experimental approach. Lower left panels, representative histogram of each group. Bar graph (right panel) shows means ± SD (n = 3). Representative data from two independent experiments are presented. (g) C57BL/6 mice were s.c. inoculated with MO4 tumor cells on day 0. Mice were left untreated or treated with the OVA257-264 peptide-loaded pMCs or the GM-pMCs on days 1 and 8. Immunohistochemical analysis of tumor tissues (day 10). CD8+ T cells (brown in the middle panels) and perforin+ cells (brown in the right panels). Hematoxylin and eosin staining served as references (left panels). Scale bar, 50 μm. Bar graph represents the number of CD8+ cells (upper panel) or perforin+ cells (lower panel) per high power field. Shown are means ± SD (n = 6). Additionally, see Figure S4a. *p < .05, **p < .01, ***p < .001.
