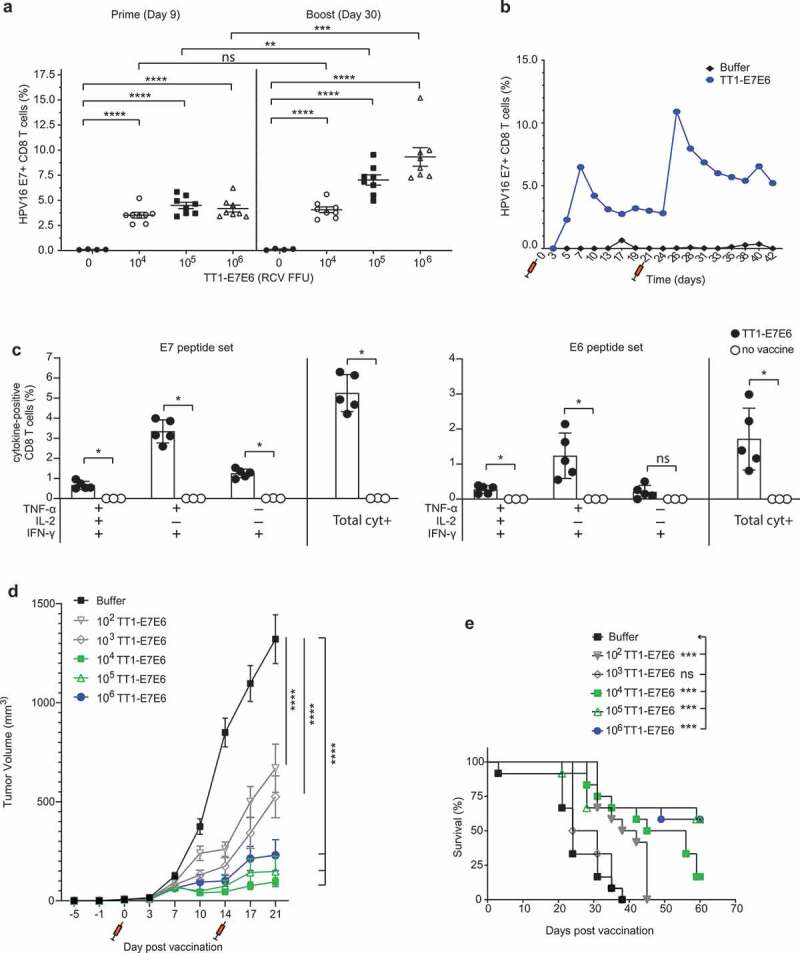
Figure 3.

TT1-E7E6 is highly immunogenic and mediates potent antitumor activity. (a) HPV16 E7 responses after immunization. Mice were immunized i.v. with increasing doses of TT1-E7E6 or buffer control on Day 0 and 21. HPV16 E7-specific CD8 (CD8+B220−) T cell frequencies were determined in the blood on Day 9 (prime) and Day 30 (boost). Each dot represents one animal. Shown are means ± SEM. N=8 mice per treatment group; n=4 mice per buffer group. Statistical analysis by unpaired Welch`s t-test. (b) Kinetics study of immunogenicity. Mice were immunized i.v. with 105 RCV FFU of TT1-E7E6 or buffer control on Day 0 and 21. HPV16 E7-specific CD8+ (CD8+B220−) T cell frequencies were determined in the blood up to 42 days. Pooled data from 6 mice per group are shown. (c) Polyfunctional CD8+ T cell responses in immunized mice. Mice were immunized i.v. with 105 RCV FFU of TT1-E7E6. Non-vaccinated naïve mice were used as controls. Frequencies of splenic CD8 T cells producing different combinations of IFN-γ, TNF-α and IL-2 in response to E7 or E6 peptide re-stimulation were determined on Day 9 post-immunization as indicated in the chart. Only cytokine combinations exceeding 0.1% on average are shown. The right-hand bar (Total cyt+) depicts the combined frequency of the three populations of cytokine-secreting cells as depicted on the left. Symbols represent individual mice. N=5 per TT1-E7E6 group, n=3 per no vaccine control group. Bars show means ± SD. Mann Whitney test, ns, not significant, * p<.05. (d) Antitumor efficacy by TT1-E7E6 immunization. Mice were inoculated with 105 TC-1 cells on Day −5. On Day 0 upon appearance of palpable tumors, mice were randomized and immunized i.v. with increasing doses of TT1-E7E6 (prime) or buffer followed by a boost injection on Day 14, as indicated by the syringe symbols. Means ± SEM. N=12 mice per group. Two-way ANOVA was performed for statistical analysis. ns: 102 vs. 103, 104 vs. 105 and 105 vs. 106. p<.01: 104 vs. 106. p<.0001: 102/103 vs. 104/105/106. In the figure, **** p<.0001. (e) Kaplan-Meier survival curves of TC-1 tumor-bearing mice receiving TT1-E7E6 treatment. Mantel-Cox test. ns, not significant, * p<.05, ** p<.01, *** p<.001, **** p<.0001.
