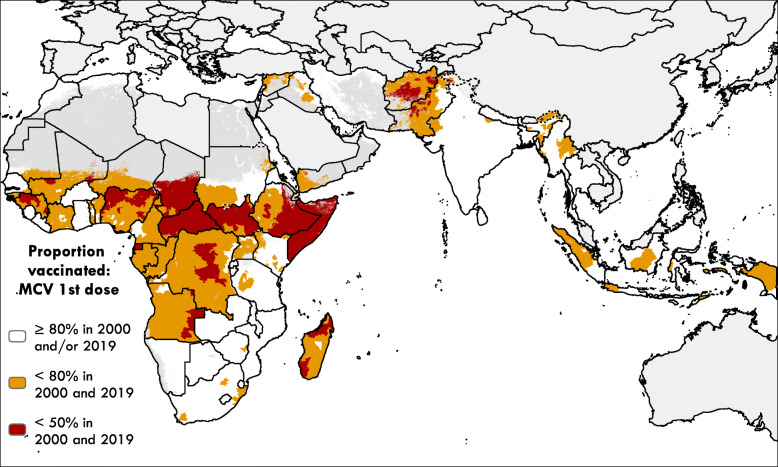
Fig. 1.
Areas of low MCV1 coverage in both 2000 and 2019 in AFR, EMR and SEAR. MCV1 coverage at the second administrative level (district or equivalent units) was estimated by Sbarra et al. [12] using survey data and geostatistical models. Areas classified as ‘barren or sparsely vegetated’ based on European Space Agency Climate Change Initiative (ESA-CCI) satellite data [15] or with fewer people than 10 per 1 × 1-km pixel based on WorldPop estimates [16] are masked in dark grey. Countries not included in the Sbarra et al. analysis are masked in light grey

