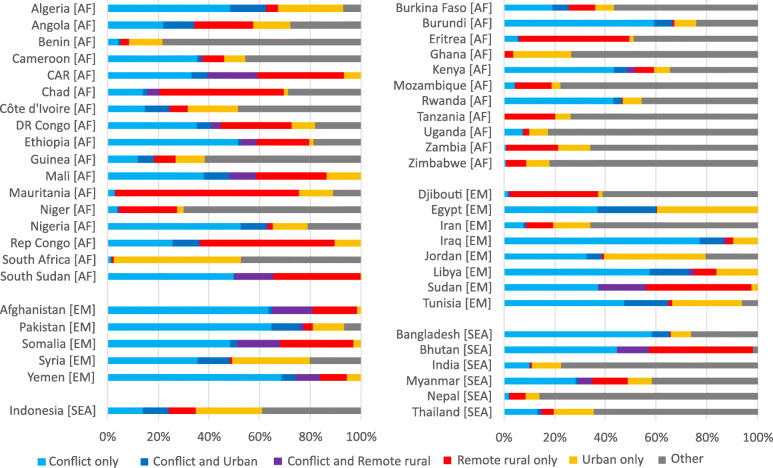
Fig. 2.
Plots showing the estimated breakdown of under-1-year-olds not receiving MCV by characteristic per country for countries with a full set of data, in AFR, EMR and SEAR. Panel a (left) shows countries with MCV1 coverage ≤ 80% and panel b (right) shows countries with MCV1 coverage > 80% according to WUENIC 2018. Estimated numbers of unvaccinated children were calculated from geospatial estimates of MCV1 coverage using methods described in Sbarra et al. [12] and population estimates from WorldPop [16], using the geographic distribution of < 1-year-old children in each country as a proxy for the geographic distribution of children of the target age for MCV1 vaccination. Conflict areas were identified using data from the ACLED [17] and Uppsala [18] conflict data programmes, 2018. The programmes provide geolocated data on conflict events, and here (following Wagner et al. [19]), conflicts resulting in fatalities in the 2 years prior to the period of study were aggregated and a buffer of 50 km was applied to the conflict fatalities data to identify ‘conflict-affected’ areas. Remote areas were defined as those with travel time > 3 h to the nearest settlement of > 50,000 people using estimates from Weiss et al. [20] and the distribution and extent of urban areas were identified using estimates from the Global Human Settlement framework [21]

