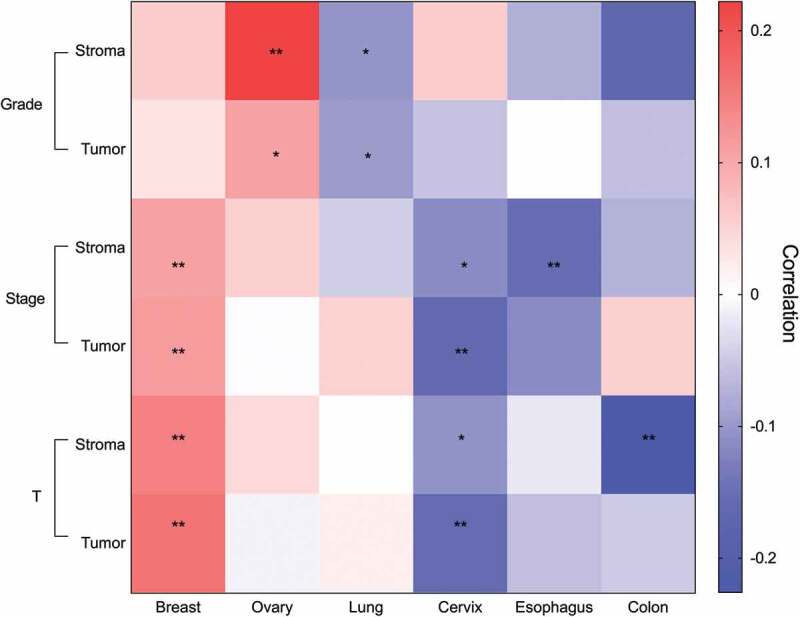
Figure 6.

Unique clinical association patterns for eosinophils in distinct primary tumors. Heatmap describing eosinophil stromal and intra-tumoral density correlation with pathological grade, clinical stage and tumor size. Correlation coefficient presented in red to blue color, as indicated in the right color bar. Pathological grade was categorized as grade 1–3, clinical stage was categorized by stages 1–4, tumor size (termed T) was classified according to TNM staging system. * p value < .05, ** p value < .01
