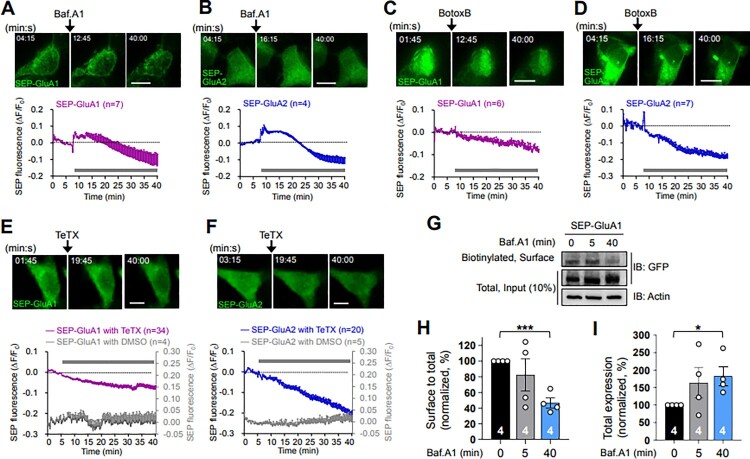
Figure 1.
Bafilomycin A1, botulinum toxin B, and tetanus toxin reduce the surface expression level of α-amino-3-hydroxy-5-methyl-4-isoxazolepropionate (AMPA) receptors. (A and B) (Upper) Representative confocal images obtained from the live-cell imaging of HEK 293 T cells overexpressing SEP-GluA1 (A) or SEP-GluA2 (B) before and after bafilomycin A1 (Baf.A1, 2 μM) treatment. Scale bars, 10 μm. (Lower) Data represent the means ± SEM of the changes in SEP fluorescence intensity (ΔF/F0). F0, the average intensity of all time points prior to drug treatment; ΔF = Ft−F0; Ft, the intensity at each time point. Gray bars, the period of Baf.A1 applied. Note the increases in SEP fluorescence during the early period following Baf.A1 treatment and the subsequent gradual reductions in fluorescence. (C and D) (Upper) Representative confocal images obtained from the live-cell imaging of HEK 293 T cells overexpressing SEP-GluA1 (C) or SEP-GluA2 (D) before and after botulinum toxin B (BotoxB, 8 μg/ml) treatment. Scale bars, 10 μm. (Lower) Data represent the means ± SEM of the changes in SEP fluorescence intensity (ΔF/F0). Gray bars, the period of BotoxB applied. Note the gradual reductions in SEP fluorescence immediately after BotoxB treatment. (E and F) (Upper) Representative confocal images obtained from the live-cell imaging of HEK 293 T cells overexpressing SEP-GluA1 (E) or SEP-GluA2 (F) before and after tetanus toxin (TeTX, 4 μg/ml) treatment. Scale bars, 10 μm. (Lower) Data represent the means ± SEM of the changes in SEP fluorescence intensity (ΔF/F0). Gray bars, the period of TeTX applied. Note the gradual reductions in SEP fluorescence immediately after TeTX treatment. (G − I) Surface expression levels of SEP-GluA1 by the Baf.A1 (2 μM) treatment were evaluated using a cell-surface biotinylation assay from the HEK 293 T cells overexpressing SEP-GluA1. Representative immunoblots are shown (G). Data represent the means ± SEM of the surface-to-total expression levels (H) and the total expression levels (I) of SEP-GluA1. *p < 0.05, ***p < 0.0005 as indicated, Student’s t test.

