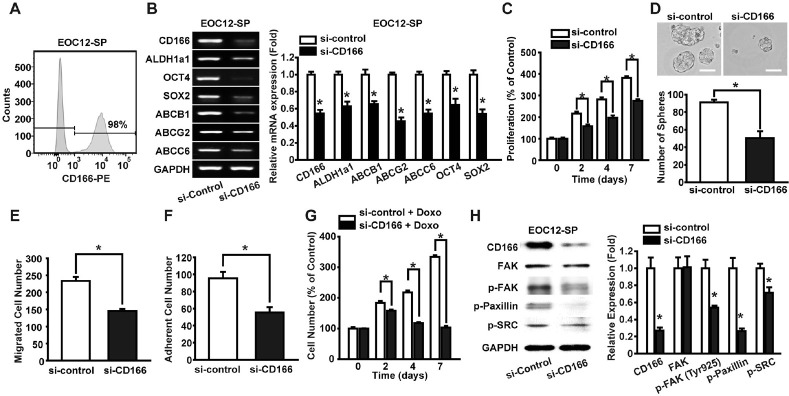
Fig. 4.
Effects of CD166 knockdown on the CSC-like characteristics of primary ovarian CSCs. (A) We measured the expression of CD166 in EOC12-SP with flow cytometry analysis. (B) RT-PCR analysis of CSC-related genes in si-control- or si-CD166-transfected EOC12-SP (left panel). The mRNA levels of each gene were quan-tified and normalized to those of GAPDH (right panel). (C) Cell proliferation of si-control- or si-CD166-transfected EOC12-SP was measured for 7 days. (D) Representative images of spheroids formed from si-control or si-CD166-transfected EOC12-SP cells at day 7 (upper panel) Scale bar = 100 µm. The numbers of spheroids were quantified at day 7 (lower panel). Cell migration (E) and adhesion (F) abilities of si-control or si-CD166-transfected EOC12-SP. (G) Drug resistance of si-control- or si-CD166-transfected EOC12-SP under doxorubicin treatment was assessed for 7 days. (H) Effects of CD166 knockdown on the FAK-associated signaling pathway activation. EOC12-SP was transfected with either control or CD166 siRNA, and we measured the expression and phosphorylation levels of FAK, paxillin, and SRC by Western blotting at 48 h after siRNA transfection (left panel), and the band intensities were quantified and normalized to those of GAPDH (right panel). Results are presented as means ± SD (n = 4), *P < 0.05 vs. si-control.

