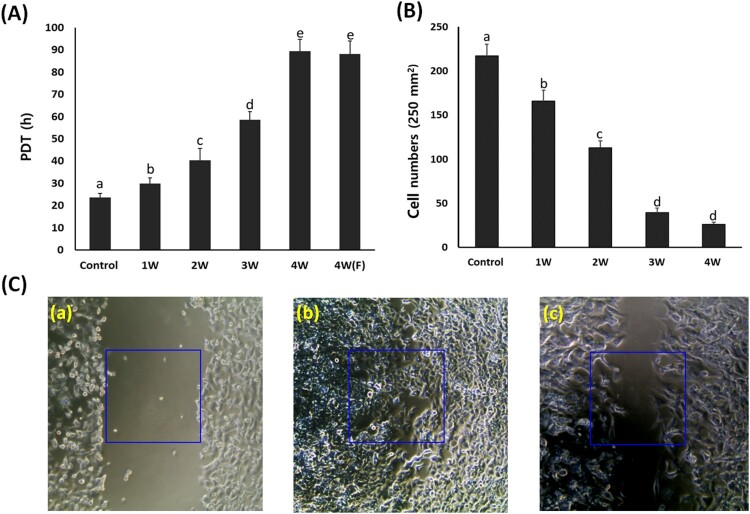
Figure 2.
Analysis of cell growth by PDT (A) and wound healing assay (B and C) in A549 cancer cells treated with 50 μM PGZ. A: Weekly analysis of cell growth by PDT in A549 cancer cells treated with 50 μM PGZ up to 4 weeks. B: Cell number migrated into one square (250 μm2) in 50 μM PGZ-treated A549 cancer cells for up to 4 weeks C: Analysis of cell migration by wound healing assay in untreated control A549 cells after scratch (a), untreated control A549 cells at 48 h after scratch (b) and A549 cells treated with 50 μM PGZ for 4 weeks at 48 h after scratch (c). a, b, c, d and e indicate different groups which are significantly different each other (p < .05, one-way ANOVA).

