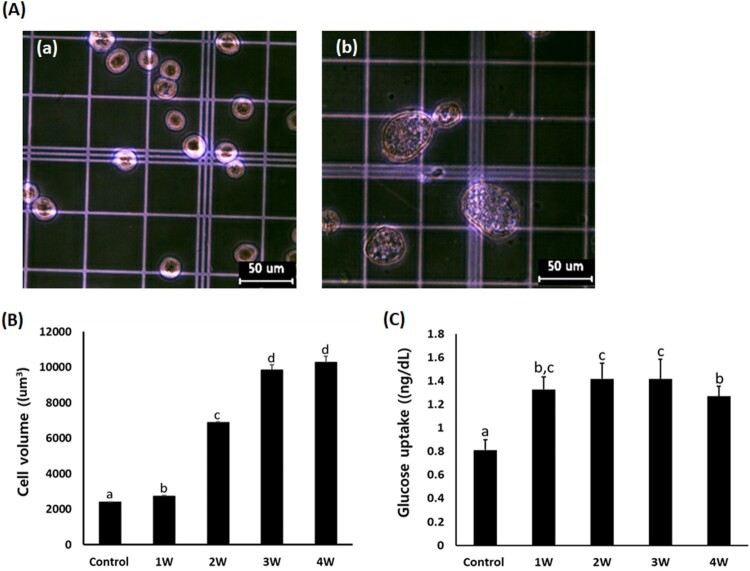
Figure 3.
A: Analysis of cell volume in untreated control A549 cells (a) and A549 cells treated with 50 μM PGZ up to 4 weeks (b). B: Weekly analysis of cell volume in A549 cancer cells treated with 50 μM PGZ up to 4 weeks. C: Weekly analysis of glucose uptake in A549 cancer cells treated with 50 μM PGZ up to 4 weeks. a, b, c and d indicate different groups which are significantly different each other (p < .05, one-way ANOVA).

