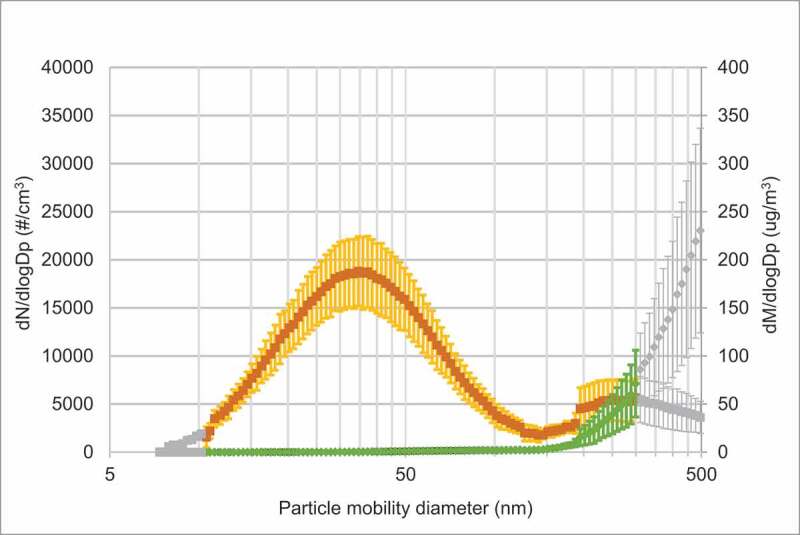
Figure 2(a).

Average SMPS size distribution of particles and corresponding mass distributions during a) days with passive vape, b) days with clean air. Mean particle size distribution (orange curve (dN/dlogDp (particle number (#)/cm3))) and particle mass (green curve (dM/dlogDp (µg/m3))) ± SD. In Figure 2(a) colored symbols are an average of six measurement series, grey symbols from at least two measurement series. In Figure 2(b) colored symbols are an average of four measurement series, grey symbols from at least one measurement series
