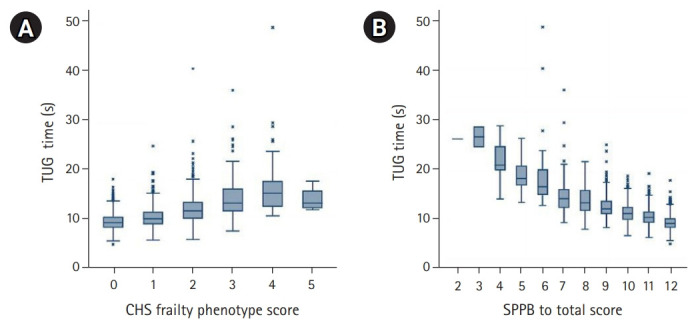
Fig. 2.

Box plots showing distributions of Timed Up and Go test (TUG) time by the Cardiovascular Health Study (CHS) frailty phenotype score (A) and Short Physical Performance Battery (SPPB) total score.

Box plots showing distributions of Timed Up and Go test (TUG) time by the Cardiovascular Health Study (CHS) frailty phenotype score (A) and Short Physical Performance Battery (SPPB) total score.