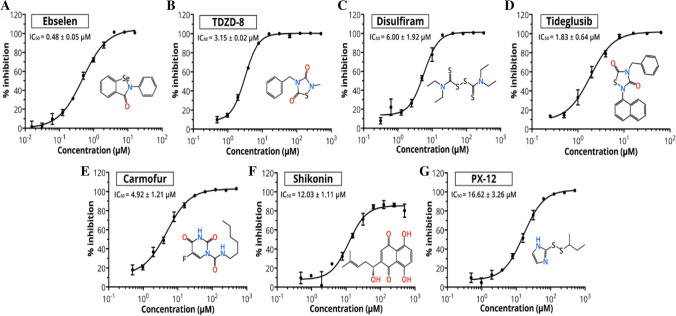
Fig. 5.
Plots showing the inhibitory activity for the potential drug leads. The hydrolytic activity of SARS-CoV-2 Mpro was measured in the presence of different concentrations of drugs. Curves produce best fits for calculating the IC50 values. Reprinted with permission from Ref. [67]

