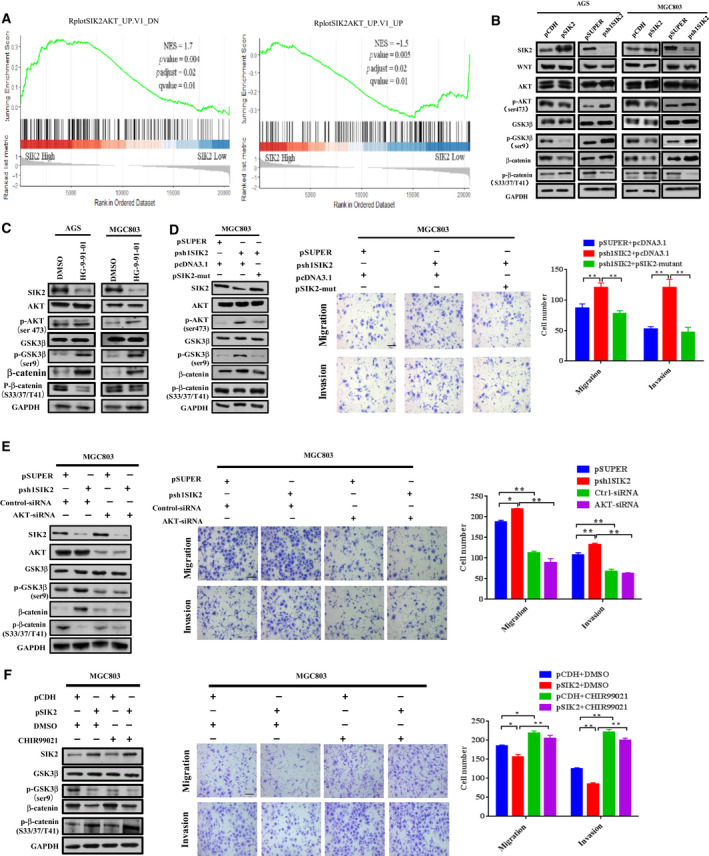
Fig 4.

SIK2 inhibits AKT/GSK3β/β‐catenin signaling. (A) Analysis of the AKT signal enrichment scores between SIK2 high and low expression groups according to the TCGA stomach cancer dataset by GSEA. (B) Western blot analysis of the expression of AKT/GSK3β/β‐catenin signaling molecules in the SIK2‐overexpressed or ‐knockdown AGS and MGC803 cells. (C) Effect of addition of SIK2 inhibitor HG‐9‐91‐01 (15 μm, 24 h) on the expression of AKT/GSK3β/β‐catenin signaling molecules in AGS and MGC803 cells. (D) Effect of reintroduction of a siRNA‐resistant SIK2 construct into the SIK2‐knockdown MGC830 cells on the expression of AKT/GSK3β/β‐catenin signaling molecules (left) and the cell migratory and invasive abilities (middle and right). Scale bar = 200 µm. (E) Effect of AKT knockdown in SIK2‐knockdown MGC830 cells on the expression of AKT/GSK3β/β‐catenin signaling molecules (left) and the cell migratory and invasive ability (middle and right). Scale bar = 200 µm. (F) Effect of addition of GSK3β inhibitor CHIR99021 (3 μm, 24 h) in SIK2‐overexpressed MGC830 cells on the expression of AKT/GSK3β/β‐catenin signaling molecules (left) and the cell migratory and invasive abilities (middle and right). Scale bar = 200 µm. Data were expressed as mean ± SD from at least three independent experiments with triple replicates per experiment. *P < 0.05; **P < 0.01.
