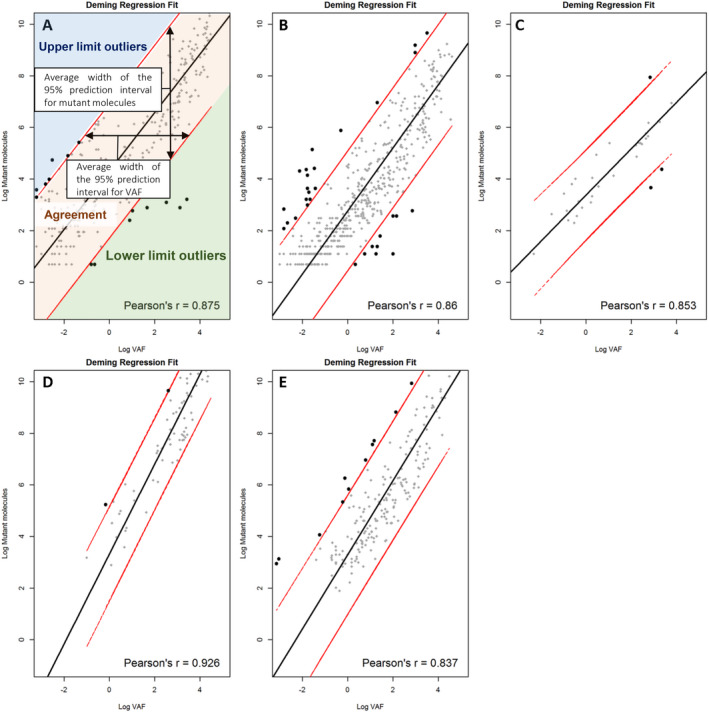
Fig. 1.

Deming regression analysis on tumor‐specific variants (TSVs) identified by Next Generation Sequencing (NGS; A–C) and digital droplet PCR (ddPCR; D, E). Red lines indicate the 95% prediction interval. (A) Cohort 1, NGS. Average width of the prediction interval for VAF = 99%, mutant copies = 183 copies. (B) Cohort 2, NGS. Average width of the prediction interval for VAF = 44%, mutant copies = 104 copies. (C) Cohort 3, NGS. Average width of the prediction interval for VAF = 49%, mutant copies = 33 copies. (D) Cohort 1, ddPCR. Average width of the prediction interval for VAF = 8%, mutant copies = 34 copies. (E) Cohort 2, ddPCR. Average width of the prediction interval for VAF = 24%, mutant copies = 100 copies.
