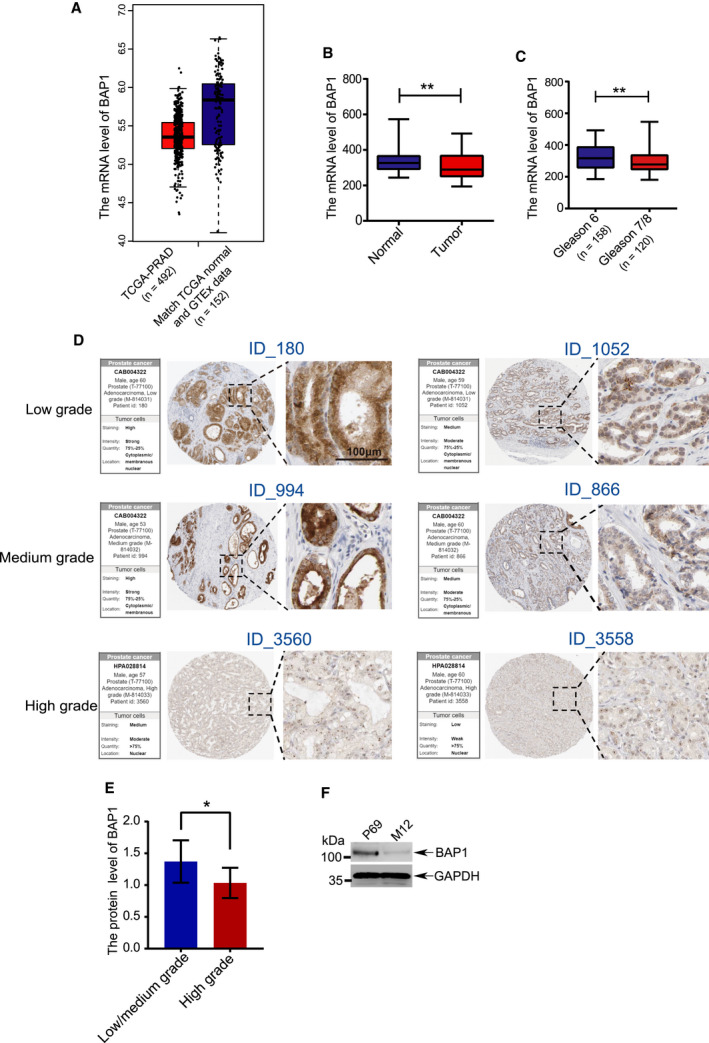
Fig. 1.

Dysregulation of BAP1 in PCa and cancer cell lines. (A) The mRNA levels of BAP1 were compared between normal tissue specimens (n = 152) and PRAD specimens (n = 492), which derived from The Genotype‐Tissue Expression (GTEx) normal prostate tissue datasets and The Cancer Genome Atlas (TCGA) PRAD datasets. (B)The mRNA levels of BAP1 were compared between prostate normal and tumor tissues derived from R2 database, including normal tissues (n = 70) and tumor tissues (n = 262). (C) The mRNA levels of BAP1 were compared based on PCa gleason scores. Gleason score 6 (n = 158), gleason score 6 and 7 (n = 120). (D) The representative images of IHC (immunohistochemistry) immunoblotted with BAP1 in PCa tissues collected from HPA (human protein atlas) database, including low, medium, and high‐grade PCa tissues. In each grade group, the representative images with strong or weak staining were presented, respectively. The high magnification insets of the images and the detailed information of staining were shown. Scale bars: 100 μm. (E) Quantification of the intensity of IHC by using the software ImageJ. n = 16 (low/medium grade), n = 26 (high grade). (F) The BAP1 protein levels were compared between in low‐tumorigenic P69 and highly tumorigenic M12 cell lines by using western blotting analysis. Error bars in B, C, and E indicated mean ± SD. Data analysis in B, C, and E was conducted by unpaired t‐test (*P < 0.05, **P < 0.01, ***P < 0.001).
