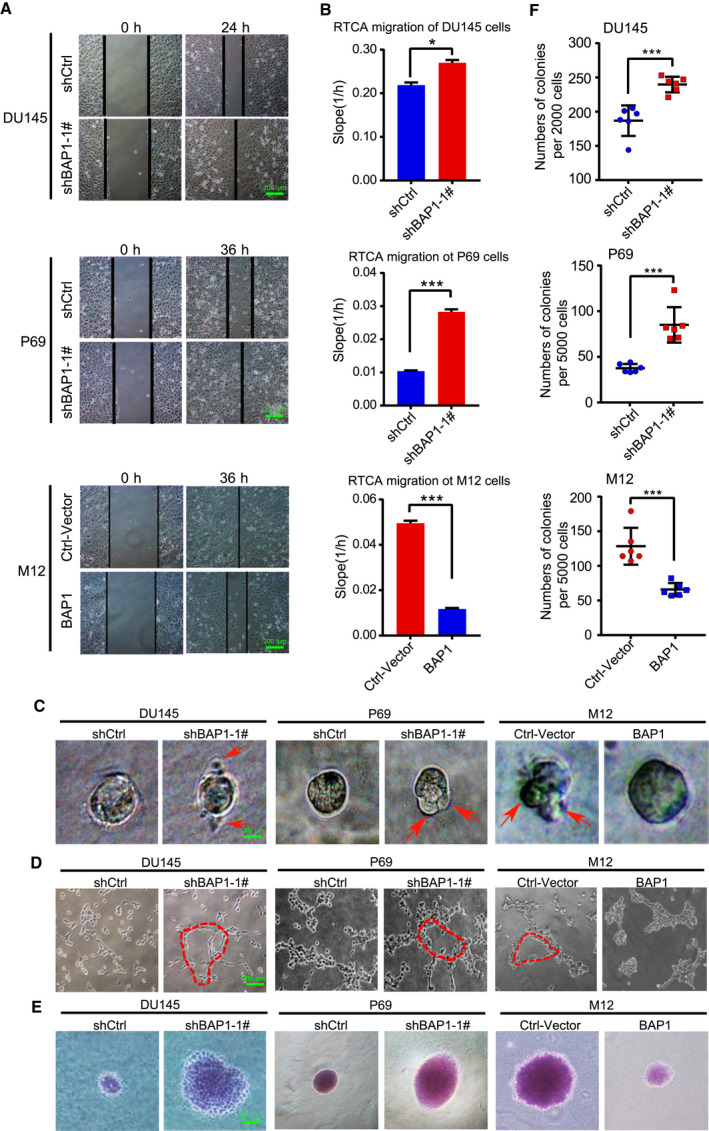
Fig. 2.

BAP1 suppresses PCa cell progression. (A) Wound‐healing assays for migration analysis of DU145, P69, and M12 stable cell lines. Representative pictures were taken at indicated times. Scale bars: 200 μm. (B) RTCA‐migration assays by using the xCELLigence RTCA‐DP system (n = 3). DU145, P69, and M12 stable cell lines were seeded into a CIM plate and subjected to a dynamic migration assay, respectively. The slope was shown as histogram. (C) 3D cell culture assays for DU145, P69 and M12 stable cell lines. The representative photographs of cell morphology were taken at 4 days. Scale bars: 10 μm. (D) Vasculogenic mimicry assays for DU145, P69 and M12 stable cells. The representative photographs of VM were taken with microscope 20 h later. Scale bars: 200 μm. (E, F) Soft‐agar colony formation assays for DU145, P69, and M12 stable cell lines (n = 6). Scale bars: 10 μm. The representative photographs of colonies were taken (E), and the number of colonies was scored (F). The DU145 and P69 stable cells used in (A–F) were established by using BAP1‐shRNA‐1#. Error bars in B and F indicated mean ± SD. Data analysis in B and F was conducted by unpaired t‐test (*P < 0.05, **P < 0.01, ***P < 0.001).
