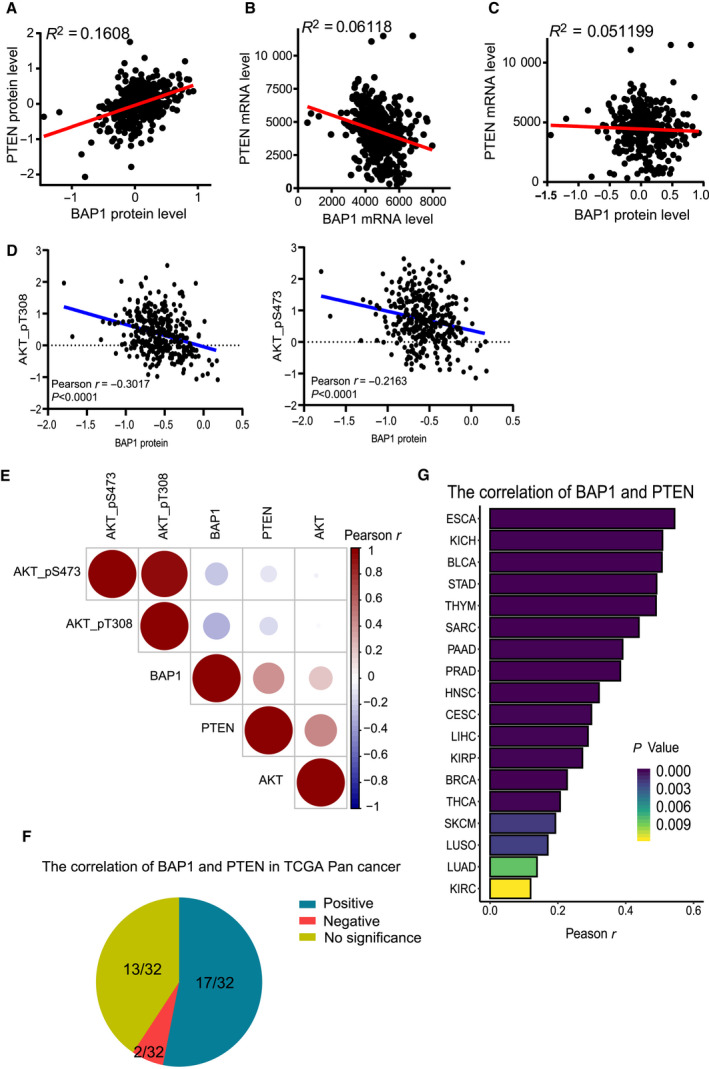
Fig. 7.

The correlation of BAP1 and PTEN in clinical PCa specimens. (A) The correlation between the protein levels of BAP1 and PTEN in clinical PCa specimens (n = 351) from TCGA database was analyzed by linear regression. (B) The correlation between the mRNA levels of BAP1 and PTEN in clinical specimens from TCGA database was analyzed by linear regression. (C) The correlation between BAP1 protein and PTEN mRNA in clinical specimens from TCGA database was analyzed by linear regression. (D) The correlation between the levels of BAP1 protein and AKT_pT308 (left), or AKT_pS473 (right) in clinical PCa specimens from TCGA database were analyzed by Pearson correlation test and linear regression. (E)The correlation between the levels of BAP1 protein, PTEN protein, AKT protein, AKT_pT308, and AKT_pS473 (right) in clinical PCa specimens from TCGA database was analyzed by Pearson correlation test. (F) The correlation between the protein levels of BAP1 and PTEN in 32 kinds of human cancers from TCGA database. (G) The histogram of human cancers in which the protein levels of BAP1 and PTEN are positively related.
