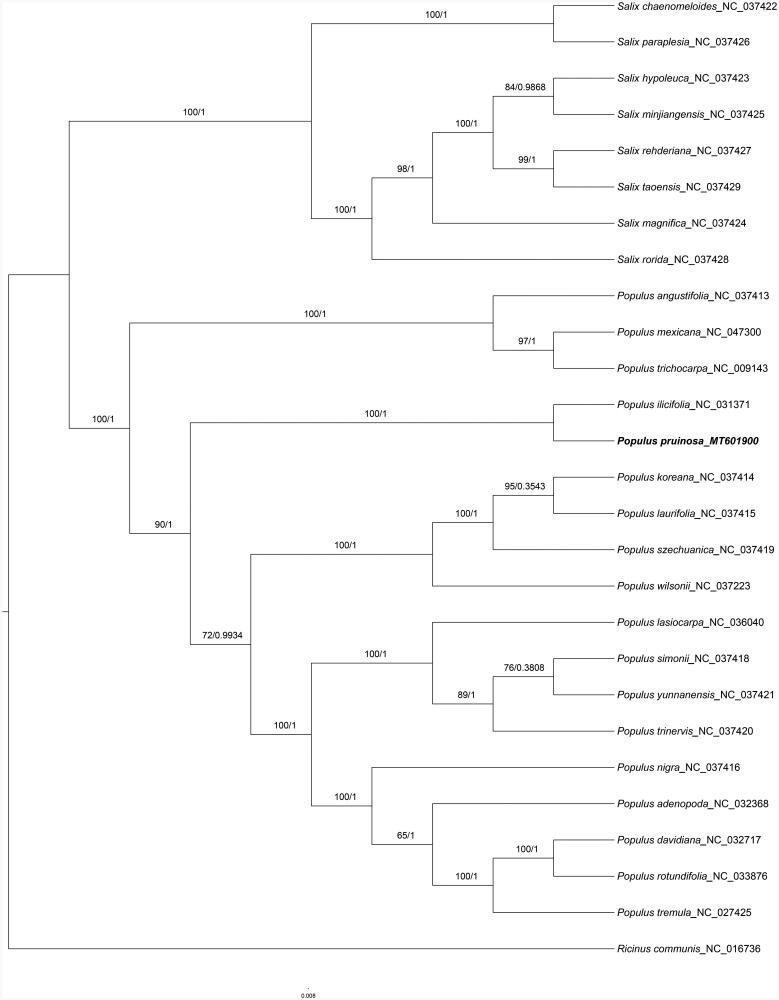
Figure 1.
Phylogenetic tree inferred by both maximum-likelihood and Bayesian analysis from 27 species. The values on each node represent the bootstrap values from maximum-likelihood (left) and the posterior probability from Bayesian inference (right), respectively. The bold part is P. pruinosa in this study..

