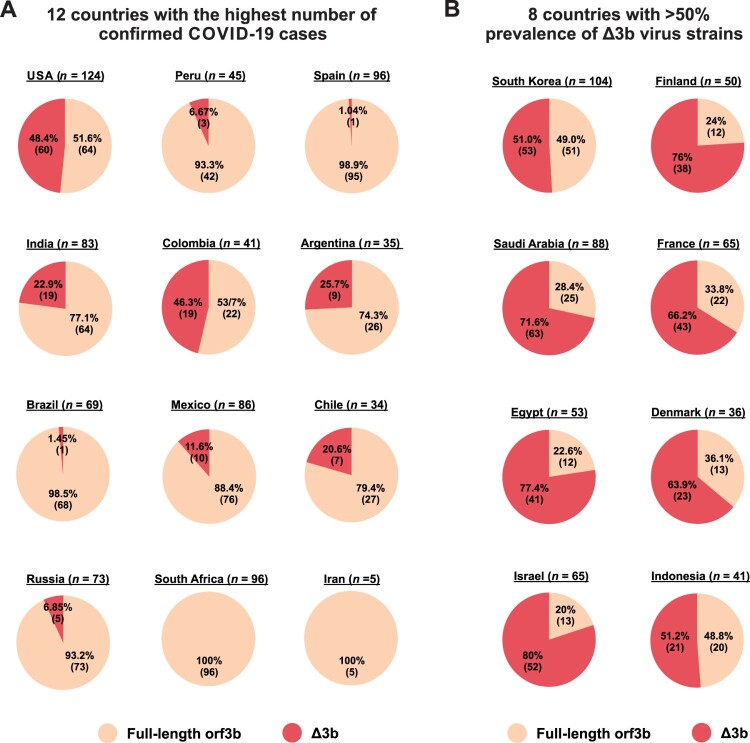
Figure 4.
Geographic prevalence of Δ3b viruses. Relative percentage of SARS-CoV-2 virus strains with full-length orf3b and Δ3b genotype was shown. Sequence data from Dec 2019 to Aug 2020 was obtained from NextStrain. The percentage and the number of available sequences for (A) 12 countries with the highest number of confirmed COVID-19 cases based on WHO (https://covid19.who.int/); and (B) 8 countries with more than 50% prevalence of Δ3b virus strains were shown. Portion of full-length orf3b was coloured orange, and portions of Δ3b was coloured red.

