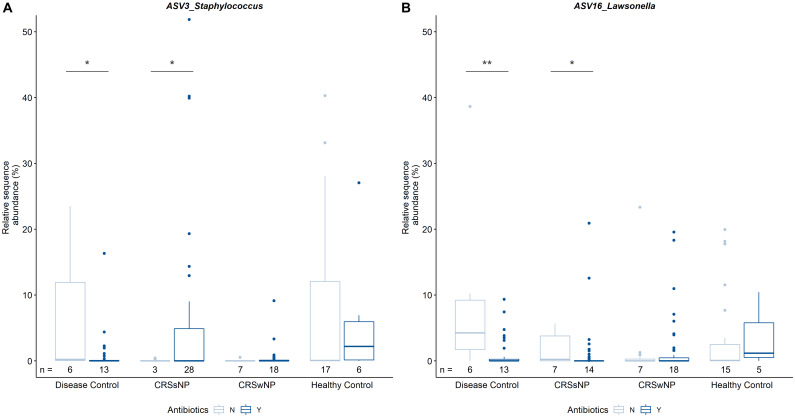
FIGURE 5.
Pairwise comparisons of relative sequence abundances between CRS and control groups. Results for ASV3_Staphylococcus (A) and ASV16_Lawsonella (B) are shown. Of note, median relative sequence abundance in some subgroups approaches zero due to relatively low prevalence of ASVs 3 and 16 in those groups and y-axis scaling. The number of patients colonized by the respective ASV per group (n) is indicated below each bar. Statistical differences are indicated according to the following significance levels: *p < 0.05, **p < 0.01.

