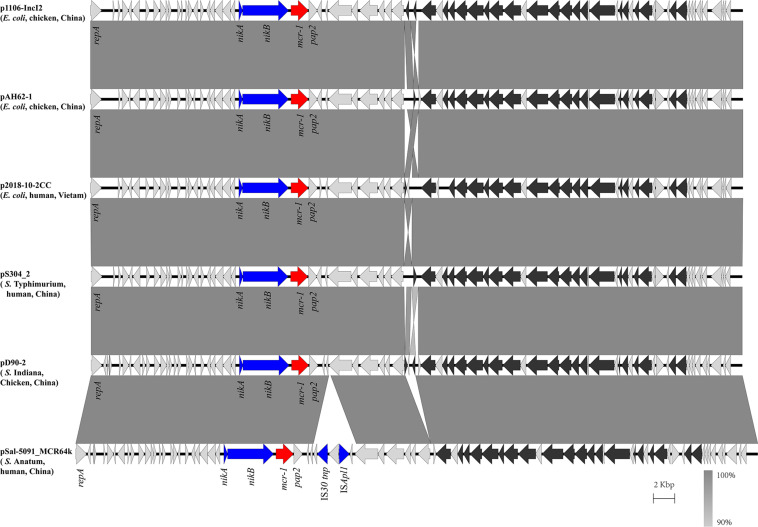
FIGURE 2.
Scaled, linear diagrams comparing the sequences between plasmid pS304_2, p1106-IncI2 (GenBank no. MG825374.1), pAH62-1 (GenBank no. CP055260.1), p2018-10-2CC (GenBank no. LC511622.1), pD90_2 (GenBank no. CP022452.1), and pSal-5091_MCR64k (GenBank no. CP045521.1). Antibiotic resistance genes are indicated in red arrows. The individual conjugation-related genes are indicated with black arrows. Blue arrows denote transposon- and integron-associated genes. Other genes are shown as gray arrows.

