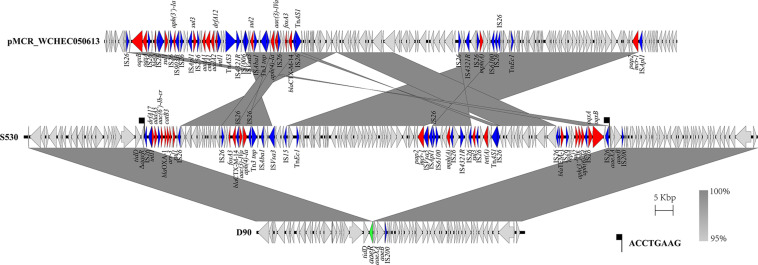
FIGURE 4.
Scaled, linear diagrams comparing the sequences between S530, D90 (GenBank no. CP022450), and pMCR_WCHEC050613 (GenBank no. CP019214). Antibiotic resistance genes are indicated in red arrows. The inserted gene aaeR is marked as the green arrow. Blue arrows denote transposon- and integron-associated genes. Other genes are shown as gray arrows.

