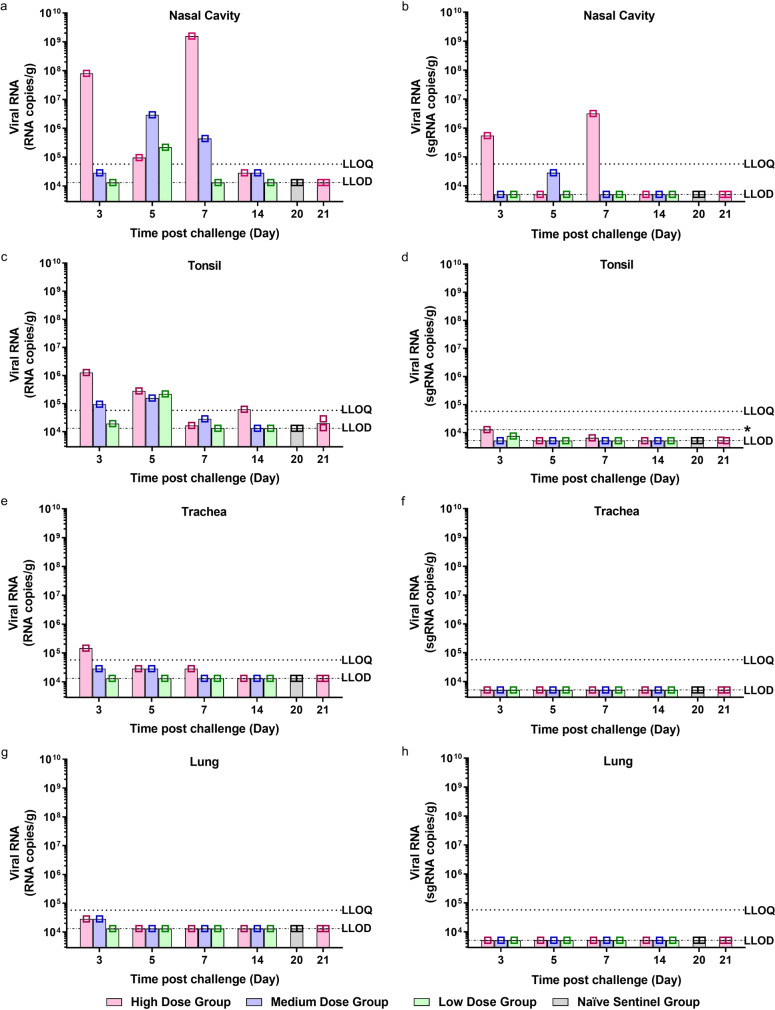
Fig. 2. Viral RNA Shedding in Tissues.
a, b Nasal cavity, c, d tonsil, e, f trachea and g, h lung were collected at euthanasia timepoints (days 3, 5, 7, 14, 20 and 21 pc) for all groups. n = 6 ferrets per group (n = 2 ferrets in the naive sentinel group), with one ferret from each group culled at each timepoint (except day 20 and 21 pc where n = 2 ferrets from the naive sentinel and high dose groups were culled respectively). Viral genomic RNA (a, c, e and f) and viral subgenomic RNA (b, d, f and h) was quantified by RT-qPCR. Bars show values for individual animals. The dashed horizontal lines show the lower limit of quantification (LLOQ) and the lower limit of detection (LLOD). *LLOD range for tonsil represents undetected samples homogenised in smaller volume.

