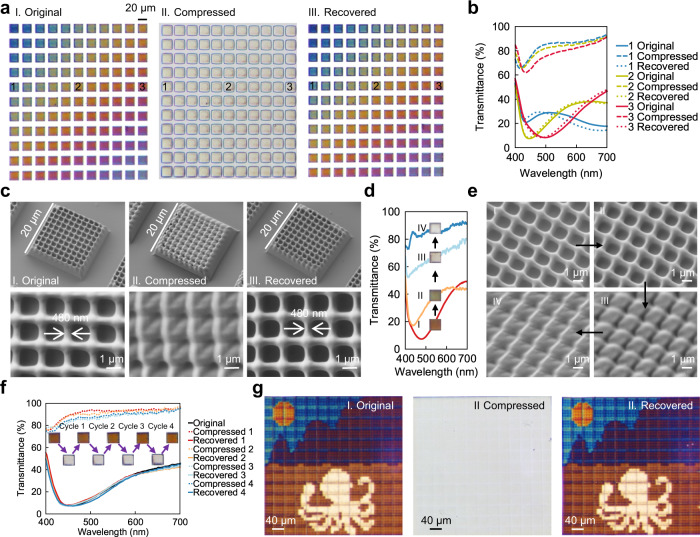
Fig. 4. Submicron scale shape memory effect.
a Different colours as printed, compressed and recovered respectively, observed by the objective lens (NA = 0.2, CA = 11.5°) at the transmittance mode (in the colour palette, the laser power was varying from 30 to 35 mW with a step of 0.5 mW in the transverse direction, and the write speed was varying from 0.6 to 1.1 mm/s with a step of 0.05 mm/s in the vertical direction). b Comparison of measured spectra of three different grid structures (marked as number 1, 2, 3 in Fig. 4a) as printed, after programming and after recovery. c Tilted (30° tilt angle) and top view of SEM images before and after programming and after recovery. d Measured spectra and e SEM images for a structure programmed into different degree of flatness. f Measured spectra of a grid structure for four programming cycles. g The painting as printed, compressed, and recovered, respectively.

