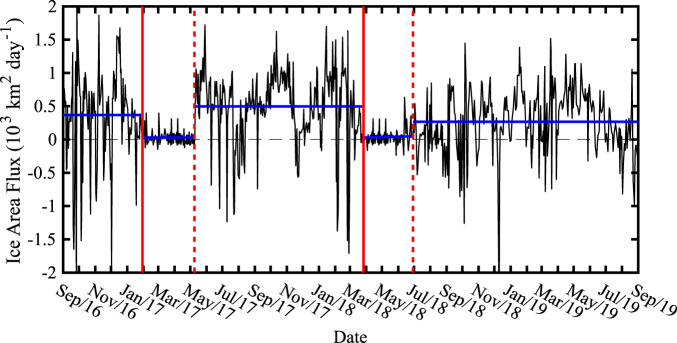
Fig. 3. Daily ice area flux (103 km2 day-1) across the southern Lincoln Sea flux gate.
The vertical solid red lines represent the best available estimates for the onset of the stoppage of ice motion along Nares Strait during 2017 and 2018 with the dashed red lines representing the best available estimate of the end of the stoppage during 2017 and 2018. The average ice area flux over various periods of interest are indicated by the blue lines. All data based on Sentinel-1 satellite-derived sea ice motion vectors.

