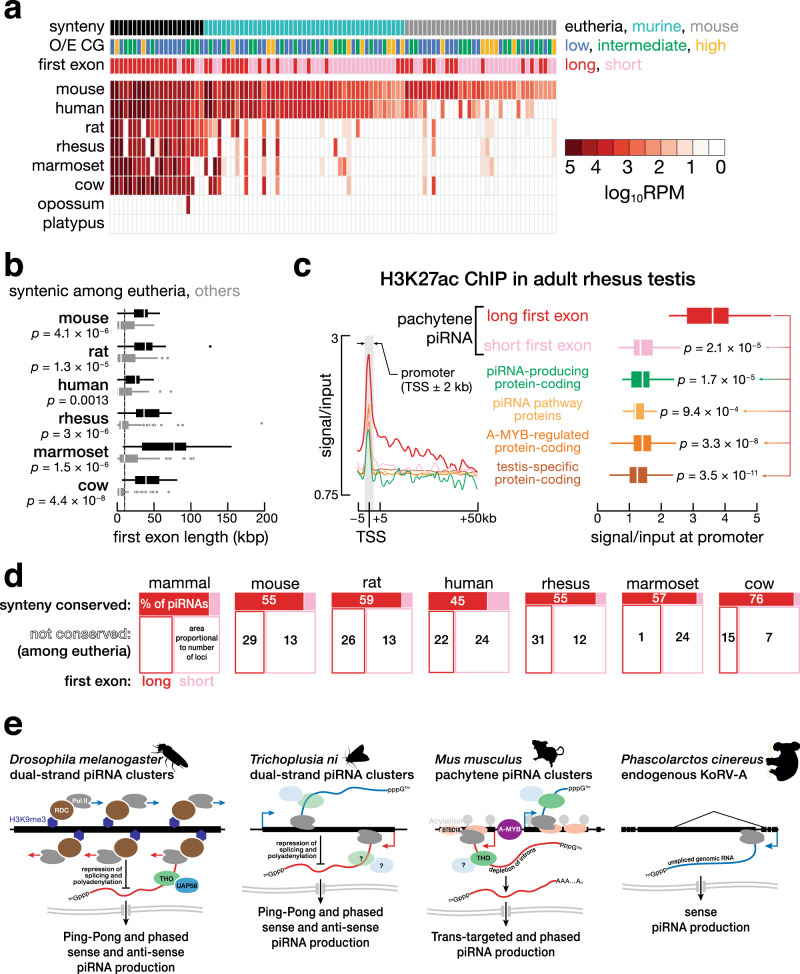
Fig. 6. Long first exons and broad histone acylation domains are conserved features of pachytene piRNA clusters in placental mammals.
a Heatmap shows piRNA abundance (RPM) for the 100 mouse pachytene piRNA clusters and the syntenic loci in several mammalian species with increasing evolutionary distance. Pachytene piRNA clusters are ranked first by conservation and then by average piRNA abundance. b First exon length for pachytene piRNA clusters in mouse, rat, human, rhesus, marmoset, and cow. Two-sided Wilcoxon rank-sum p values are provided for comparing eutherian-conserved with other pachytene piRNA clusters in mouse (n = 21 and 79), rat (n = 20 and 94), human (n = 19 and 70), rhesus (n = 18 and 115), marmoset (n = 17 and 115), and cow (n = 18 and 99). Vertical line marks 10 kbp. c Left, meta-gene plot shows average H3K27ac signal in rhesus adult testis across the −5 to +50 kb window flanking the TSS for six groups of genes: 54 long-first-exon pachytene piRNA clusters, 79 short-first-exon pachytene piRNA clusters, 56 piRNA clusters that overlap protein-coding genes, 17 piRNA pathway genes, 593 A-MYB-regulated protein-coding genes, and 745 testis-specific protein-coding genes. Right, boxplots show the H3K27ac density relative to input for the same six groups of genes. d Mosaic plots for pachytene piRNA clusters. Filled boxes, eutherian-conserved pachytene piRNA clusters; unfilled boxes, other pachytene piRNA clusters. Red, long-first-exon and long intronless pachytene piRNA clusters; pink, short-first-exon and short intronless pachytene piRNA clusters. The area of each patch indicates the number of pachytene piRNA clusters in the group; numbers report the percentage of total piRNAs in each group. e Schematic diagram shows our proposed model that suppression of splicing steers piRNA precursor transcripts into the piRNA biogenesis pathway across animal species. Credit: silhouettes in e are from http://phylopic.org. The cabbage looper silhouette was by Gareth Monger (https://creativecommons.org/licenses/by/3.0/). The silhouettes have not been altered in any way. For all boxplots, whiskers show 95% confidence intervals, boxes represent the first and third quartiles, and the vertical midline is the median. Two-sided Wilcoxon rank-sum tests were used to calculate p values.

