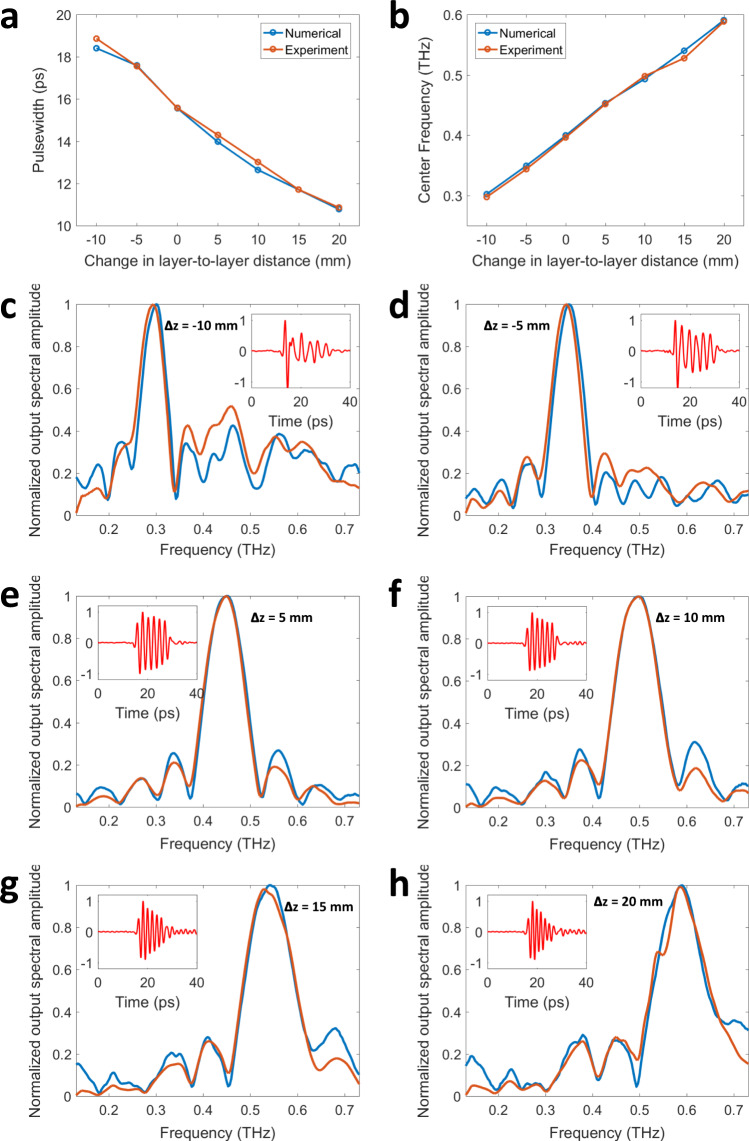
Fig. 4. Pulse width tunability of diffractive networks.
a Numerically calculated and experimentally measured temporal pulse widths and (b) the corresponding shifts in the center frequency are depicted as a function of the inter-layer distances of a pulse shaping diffractive network that was originally trained for synthesizing a square pulse width of 15.50 ps (Δz = 0 mm, see Supplementary Fig. 5). c–h The numerically computed (blue) and the experimentally measured (orange) normalized spectral amplitudes, with the inset plots showing the experimentally measured temporal waveform (red) when the layer-to-layer distances are changed by (c) Δz = −10 mm, (d) Δz = −5 mm, (e) Δz = 5 mm, (f) Δz = 10 mm, (g) Δz = 15 mm and (h) Δz = 20 mm. The negative (positive) sign indicates that the inter-layer axial distances decrease (increase).

