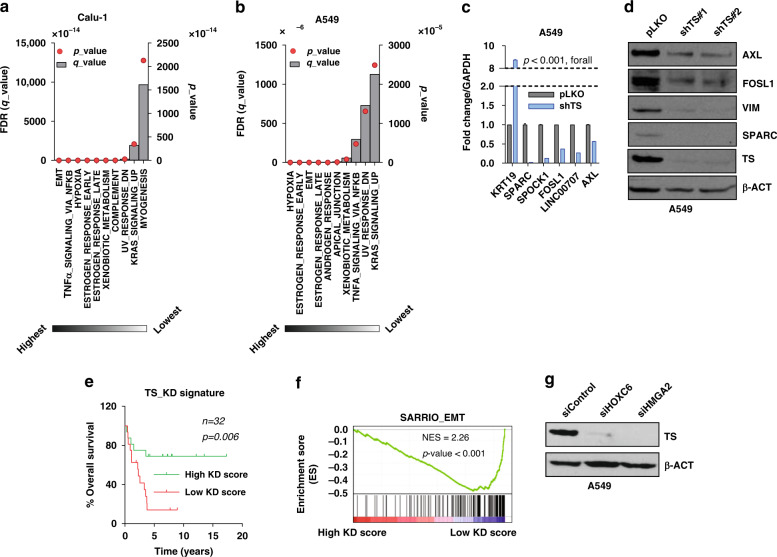
Fig. 3. TS expression correlates with EMT gene signature.
Gene set enrichment analysis of RNA-seq data of a Calu-1 cell sorted for high and low TYMS promoter activity and b A549 cells after transduction of shTS and scrambled pLKO backbone as control. c q-RT-PCR quantification of gene signature from A549 cells. p-value represents multiple t-Test. d Validation of TS-mediated downregulation of indicated genes at protein levels in A549 cells with TS knock-down. e Survival analysis of NSCLC patients from data set GSE101929 based on a knock-down score generated from A549 gene signature in b. p-value is represented as Log-rank (Mantel-Cox) test. f Gene set enrichment analysis with overlapping of TS knock-down score with EMT-signature in SCC patients from data set GSE4573. g A549 cells transiently transfected with 50 nM siRNA targeting transcription factors HOXC6 and HMGA2 identified from a.

