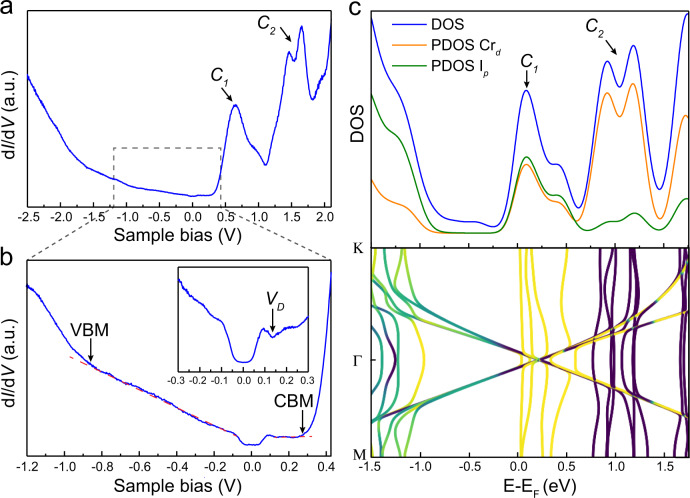
Fig. 2. The electronic structure of G/CrI3.
a The dI/dV spectrum of G/FL-CrI3/Gr taken in a large sample bias window (−2.5 V ≤ Vs ≤ 2.1 V). Two prominent double-peak features are indicated by C1 and C2, respectively. b The dI/dV spectrum of G/FL-CrI3/Gr taken in a small sample bias window (−1.2 V ≤ Vs ≤ 0.42 V). The band edges are indicated by VBM and CBM. The inset shows the dI/dV spectrum near the Fermi level (−0.3 V ≤ Vs ≤ 0.3 V). The local conductance minimum is indicated by VD. c Calculated density of states (DOS) and band structure of G/ML-CrI3 using Hubbard U = 0.5 eV. Both DOS and the projected DOS (PDOS) on iodine p orbitals and chromium d orbitals are shown. The color-coding in the band structure indicates the expectation value of spin Sz with yellow and purple corresponding to spin-up and -down, respectively.

