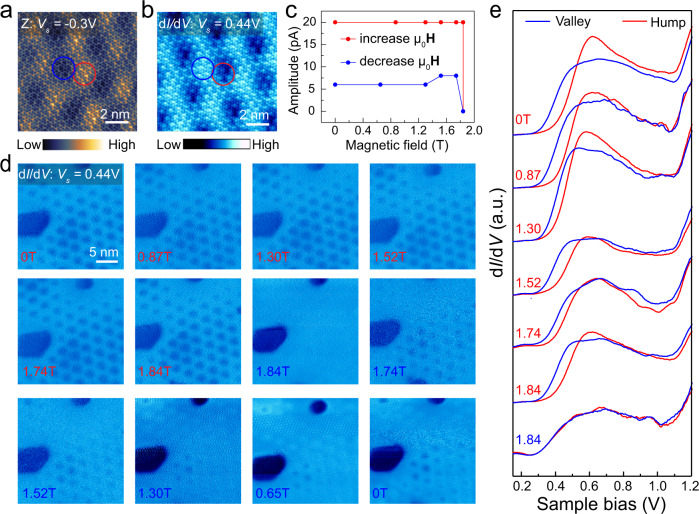
Fig. 4. Magnetic field-dependent moiré contrast in dI/dV maps.
a STM image (Vs = −0.3 V, It = 0.2 nA) shows the moiré pattern of G/FL-CrI3/Gr. The lower (higher) region is referred as moiré valley (hump) indicated by the blue (red) circle. b The corresponding dI/dV map (Vs = 0.44 V, It = 0.5 nA). c Magnetic field-dependent moiré contrast in the dI/dV maps (Vs = 0.44 V, It = 0.5 nA). d Magnetic field-dependent dI/dV maps (Vs = 0.44V, It = 0.5 nA). e Magnetic field-dependent dI/dV spectra taken at moiré valley (blue) and hump (red).

