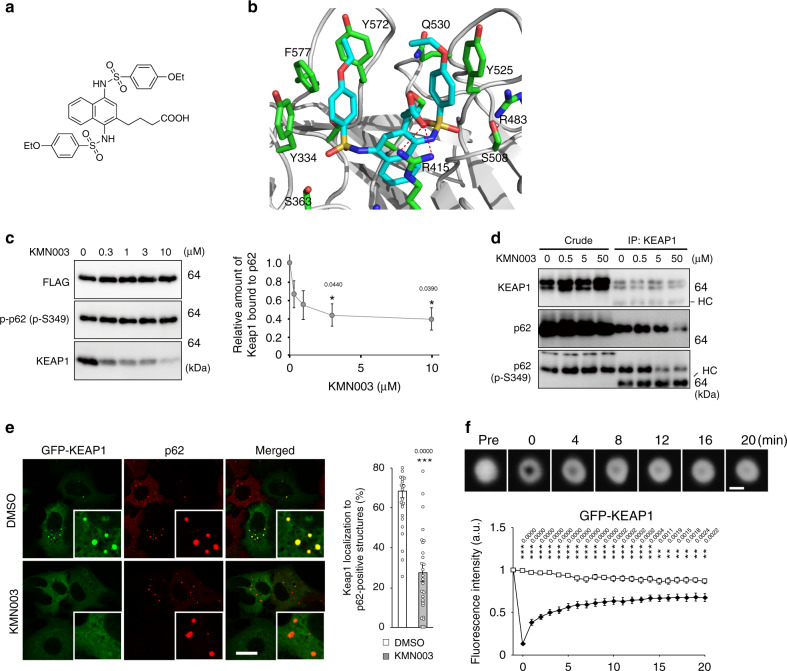
Fig. 6. Reversible translocation of Keap1 on the p62-gels.
a Structural formulas of KMN003. (b) Modelling of Keap1 (white)–KMN003 (cyan). Overall structure of Keap1-DC, shown as a ribbon model. KMN003 (cyan) and some of the potential interacting residues of Keap1-DC are shown in stick representation (green). Potential hydrogen-bonds are depicted as dotted red lines. c In vitro pull-down assay. Recombinant Keap1-DC was allowed to form a complex with Strep-FLAG-tag p62, and then KMN003 was mixed with the complex at indicated concentration. Keap1-DC binding to Strep-FLAG-tag p62 was estimated by immunoblot analysis with Keap1 antibody. Data are representative of three independent experiments. Right graph indicates the quantitative densitometric analysis of Keap1 bound to p62 (n = 3). Data are means ± s.e. *p < 0.05 as determined by two-sided Welch’s t-test. Source data are provided as a Source Data file. d Immunoprecipitation assay. Huh-1 cells were cultured in regular medium in the presence or absence of KMN003 at indicated concentration for 12 h. Cell lysates were immunoprecipitated with Keap1 antibody, and the immunoprecipitants were subjected to immunoblot analysis with the indicated antibodies. Data shown are representative of three separate experiments. HC indicates heavy chain. Source data are provided as a Source Data file. e Immunofluorescence microscopy. Huh-1 cells expressing GFP-Keap1 were cultured in regular medium in the presence or absence of 10 μM KMN003 for 24 h and then immunostained with p62 antibody. Data are means ± s.e. of the number of p62-positive dots with GFP-Keap1 in Huh-1 (n = 30). ***P < 0.001 as determined by two-sided Welch’s t-test. Bars: 20 μm. Source data are provided as a Source Data file. f Time lapse microscopic analysis. Huh-1 cells were transfected with GFP-Keap1. 24 h after the transfection, the structures labelled by GFP-Keap1 were photobleached, and then time of fluorescent recovery was measured. Data are means ± s.e of nonphotobleached (n = 8) and photobleached (n = 10) dots. **p < 0.01, and ***p < 0.001 as determined by two-sided Welch’s t-test. Bar: 2 μm. Source data are provided as a Source Data file.

