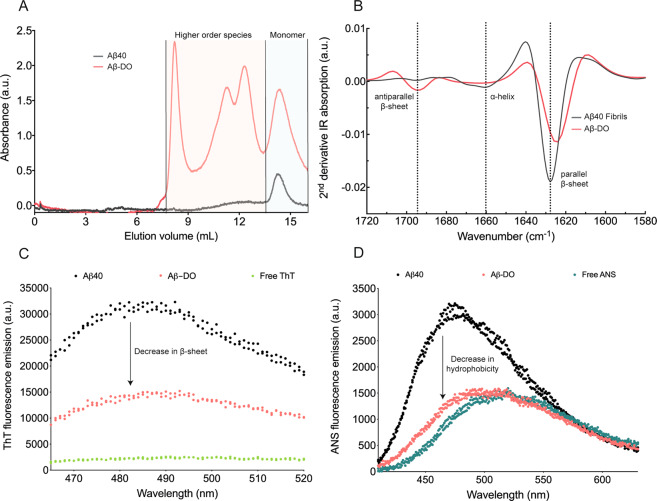
Fig. 4. Size distribution and structural characterisation of Aβ-DOs.
a Size-exclusion chromatography profiles of Aβ40-noDOs (black line) compared to Aβ-DOs (red line). b Second derivative of ATR-FTIR spectra of Aβ40 fibrils (black line) and Aβ-DOs (red line). c Fluorescence emission spectra of ThT in the absence (green), or in the presence of Aβ40-noDOs (black) or Aβ-DOs (red). d Fluorescence emission spectra of ANS in the absence (green), or in the presence of Aβ40-noDOs (black) or Aβ-DOs (red).

