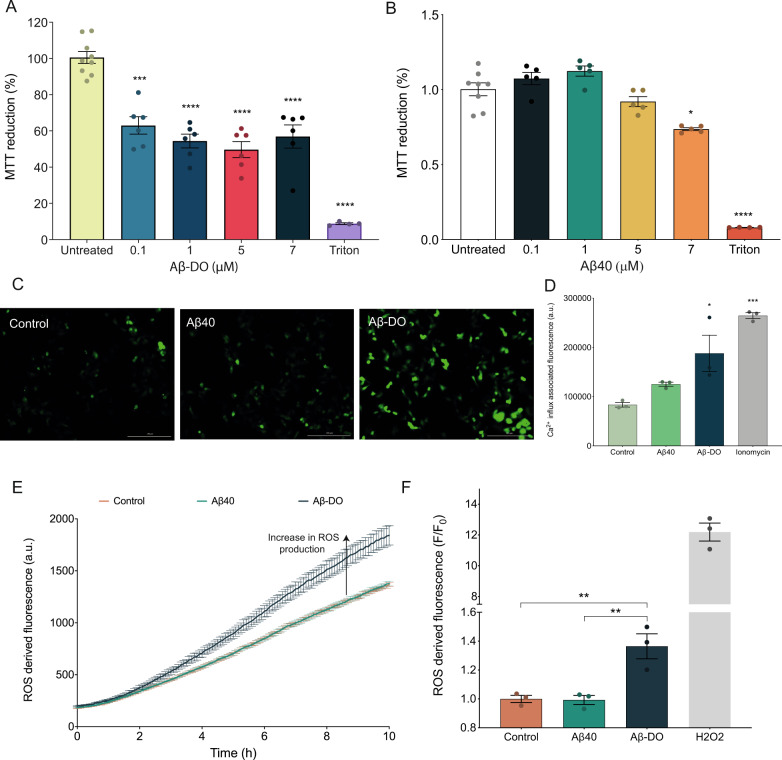
Fig. 5. Aβ-DOs are toxic to neuroblastoma cells.
a Cell viability determined by the MTT reduction test in cells exposed to increasing concentrations of Aβ-DOs. b Intracellular Ca2+ influx associated fluorescence upon 40 min of treatment with buffer (light green), Aβ40-noDOs (green) or Aβ-DOs (dark green). F/F0 is the ratio between the Ca2+ influx-derived fluorescence intensity in the presence (F) and absence (F0) of Aβ aggregates. c Representative images of intracellular Ca2+ influx upon 40 min treatment with buffer (left), Aβ40-noDOs (centre) or Aβ-DOs (right). d Kinetics of ROS production of cells at 37 °C either in the absence or in the presence of Aβ40-noDOs or Aβ-DOs. e F/F0 ratio between the ROS-derived fluorescence intensity in the presence (F) and absence (F0) of Aβ40-noDOs (green) and Aβ-DOs (dark green) at 10 h; the untreated control is shown in orange. Positive control of 0.01% H2O2 is shown in grey. For the MTT test, error bars represent means ± SEM of five replicates. For calcium influx and ROS production, error bars represent means ± SEM of three replicates. *p ≤ 0.05, **p ≤ 0.01, ***p ≤ 0.001, ****p ≤ 0.0001 relative to untreated cells are shown.

