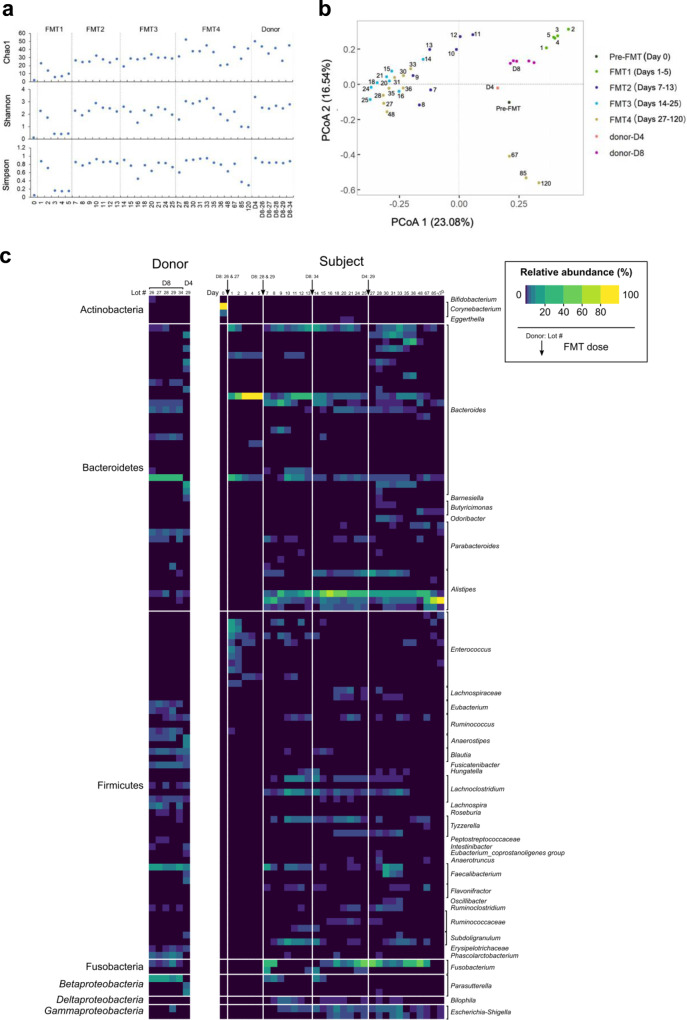
Fig. 2. Changes in gut bacterial community composition in GvHD patient after FMTs.
a Richness, Shannon and Simpson diversity of bacterial communities in donor stools and the patient before and after FMTs. b Principal coordinate analysis (PCOA) of bacterial community composition in the patient following FMT based on Bray-Curtis dissimilarities. c Heat map summarizing fecal bacterial community composition in donor stools and the patient. Increasing relative abundances are representing by lighter colors (black to yellow). Taxonomic labels on left of figure indicate phylum assignments (class-level for Proteobacteria), labels on right indicate genus. Pre-FMT represents stool sample collected before the first FMT. FMT1, FMT2, FMT3, and FMT4 represent stool samples collected after the 1st (days 1–5), 2nd (day 6–13), 3rd (day 14–25) and 4th (day 27–120) FMTs respectively. D8-26, D8-27, D8-28, D8-29, D8-34 indicate fecal samples collected from donor D8 on different days, whereas only one fecal sample collected from donor D4 was used in the FMT. FMT1, FMT2, FMT3, FMT4 were performed using D8-26 and D8-27, D8-28 and D8-29, D8-34, D4 respectively. All analyses were based on bacterial profiles from 16 S rRNA gene sequencing data.

