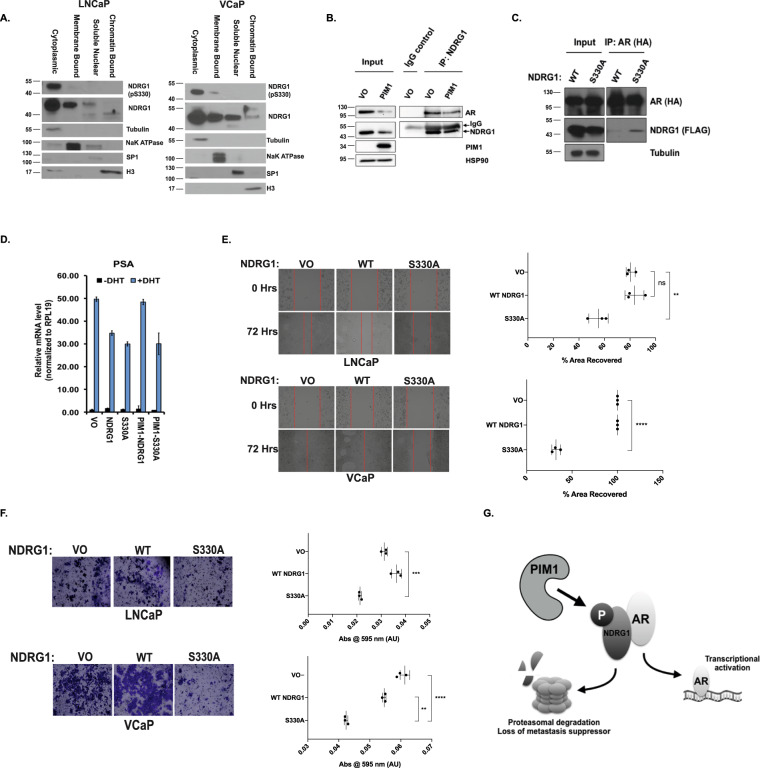
Fig. 6. NDRG1-AR interaction is modulated by NDRG1 phosphorylation.
A LNCaP and VCaP cells were fractionated into membrane, cytoplasmic, soluble nuclear and chromatin-bound fractions and blotted for NDRG1 pS330 and NDRG1. Markers for each compartment were also blotted for to ensure the fidelity of the fractionation. B Endogenous NDRG1 co-immunoprecipitates with AR in LNCaP cells. C AR interacts more robustly with non-phosphorylated NDRG1. 293 T cells were transfected with either NDRG1 WT or NDRG1 S330A mutant (FLAG-tagged) and WT-AR (HA-tagged). AR was immunoprecipitated using HA beads, and Western blot performed for AR (HA) and NDRG1 (FLAG). D LNCaP transfected with indicated genes were steroid-starved for 48 h, and subsequently treated with 10 nM DHT. mRNA levels for PSA were measured relative to RPL19 by qRT-PCR. n = 3 and error bars represent the standard deviation. E–F Migration and matrigel invasion assays. LNCaP-PIM1 and VCaP-PIM1-expressing cells were transfected with vector only (VO), NDRG1 WT, or NDRG1 S330A. Cell migration was determined using a scratch assay. Micrographs of the cells at 0 and 72 h are shown, and percent area remaining after 72 h was quantitated. Invasion assay through matrigel was performed in LNCaP-PIM1 and VCaP-PIM1 cells expressing the indicated NDRG1 constructs, and cells invading through matrigel were stained and shown as micrographs. The stain was extracted from the cells that migrated through the matrigel and quantitated spectrophotometrically at 595 nm wavelength. n = 3 independent samples for each experiment. T test; **p < 0.01, ***p < 0.001, ****p < 0.0001, ns not significant. G Model illustrating the effect of PIM1 phosphorylation on NDRG1 and its co-repression of AR.

