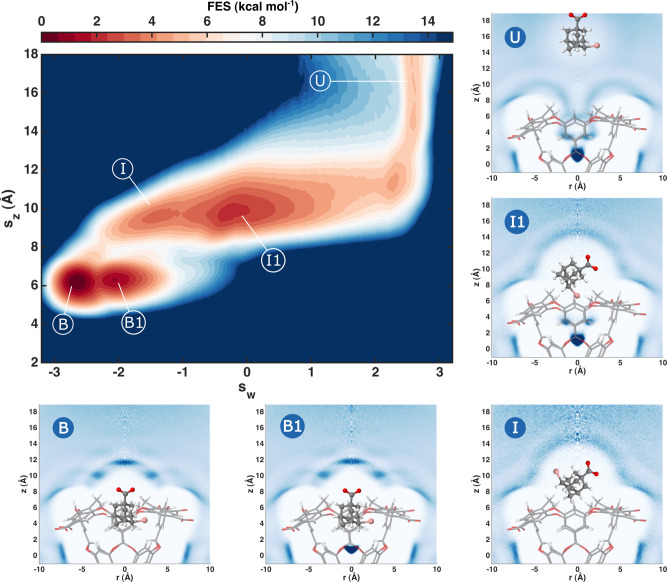
Fig. 5. Binding FES of ligand G4 with a study of the water presence in the visited states.
We show the two-dimensional FES of the ligand G4 with respect to sz and Deep-LDA CV sw. Different adjacent colours correspond to a free energy difference of 1 kBT ≈ 0.6 kcal mol−1. We highlight some relevant states over which we perform plain molecular dynamics (MD) simulations to measure the presence of water. We show histograms of the water oxygen atoms’ density in cylindrical coordinates z, r. Each histogram is normalised by the density value in its top-right corner and darker colours correspond to higher-water-density regions. The position of the ligand in these plots is illustrative.

