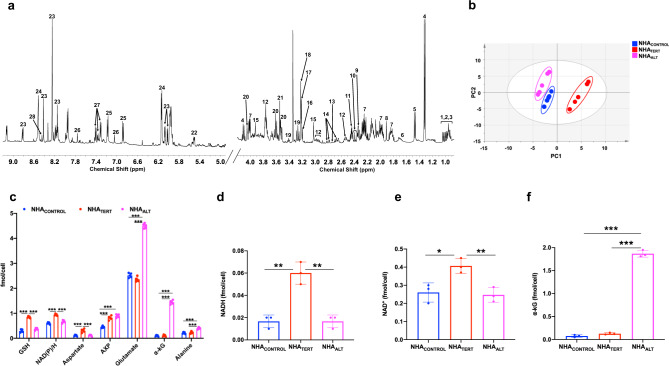
Fig. 1. TERT expression and the ALT pathway are associated with unique 1H-MRS detectable metabolic signatures in low-grade glioma cells.
a Representative 1H-MRS spectrum from NHATERT cells. 1–3: isoleucine, leucine, valine; 4: lactate; 5: alanine; 6: leucine; 7: 2-hydroxyglutarate; 8: acetate; 9: glutamate; 10: α-KG; 11: glutamine; 12: glutathione; 13: cystathionine; 14: aspartate; 15: creatine; 16: choline; 17: phosphocholine; 18: glycerophosphocholine; 19: taurine; 20: myo-inositol: 21: glycine; 22: UDP-N-acetylglucosamine; 23: NAD(P)/H 24: AXP; 25: tyrosine; 26: histidine 27: phenylalanine; 28: formate. b Scores plot of PCA for NHACONTROL (blue circles), NHATERT (red circles), and NHAALT (magenta circles) cells (n = 5 biological replicates each). c Metabolite concentrations quantified from 1H-MRS spectra for NHACONTROL (blue circles), NHATERT (red circles), and NHAALT (magenta circles) models (n = 5 biological replicates each). Levels of NADH (d), NAD+ (e), and α-KG (f) measured by spectrophotometric assays in NHACONTROL (blue circles), NHATERT (red circles), and NHAALT (magenta circles) models (n = 3 biological replicates each). Results are presented as mean ± standard deviation. Statistical significance was assessed using an unpaired Student’s t test assuming unequal variance with p < 0.05 considered significant. Correction for multiple comparisons was performed using the Holm–Šídák method. *** represents statistical significance with p < 0.005; ** represents statistical significance with p < 0.01; * represents statistical significance with p < 0.05. Also, refer to Supplementary Fig. 2 and Supplementary Fig. 3. Source data and exact p values are provided as a source data file.

