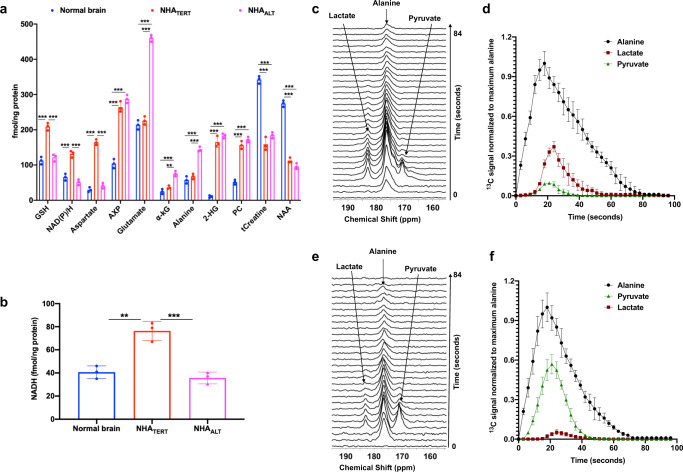
Fig. 5. 1H-MRS and hyperpolarized [1-13C]-alanine can detect TMM status in orthotopic tumor xenografts.
Quantification of steady-state metabolite levels by 1H-MRS (a) and NADH levels by spectrophotometry (b) in extracts from ex vivo tissue samples from tumor-free healthy rats (blue circles) or rats bearing either orthotopic NHATERT (red circles) or NHAALT (magenta circles) tumor xenografts. 2-HG: 2-hydroxyglutarate; PC: phosphocholine; tCreatine: total creatine; NAA: N-acetylaspartate. c Representative array of dynamic 13C-MRS spectra acquired from a 15 mm slab through the brain following intravenous injection of hyperpolarized [1-13C]-alanine into a rat bearing an orthotopic NHATERT tumor. d Dynamic build-up curves for hyperpolarized [1-13C]-alanine (black circles), hyperpolarized [1-13C]-pyruvate (green triangles) and hyperpolarized [1-13C]-lactate (maroon squares) in rats bearing orthotopic NHATERT tumor xenografts. e Representative 13C spectral array of hyperpolarized [1-13C]-alanine metabolism in a 15 mm slab of the brain in a rat bearing an orthotopic NHAALT tumor xenograft. f Build-up curves for hyperpolarized [1-13C]-alanine (black circles), hyperpolarized [1-13C]-pyruvate (green triangles) and hyperpolarized [1-13C]-lactate (maroon squares) in rats bearing orthotopic NHAALT tumor xenografts. All experiments were performed on three biological replicates (n = 3). Results are presented as mean ± standard deviation. Statistical significance was assessed using an unpaired Student’s t test assuming unequal variance with p < 0.05 considered significant. Correction for multiple comparisons was performed using the Holm–Šídák method. *** represents statistical significance with p < 0.005; ** represents statistical significance with p < 0.01. Also, see Supplementary Fig. 5. Source data with exact p values are provided as a source data file.

