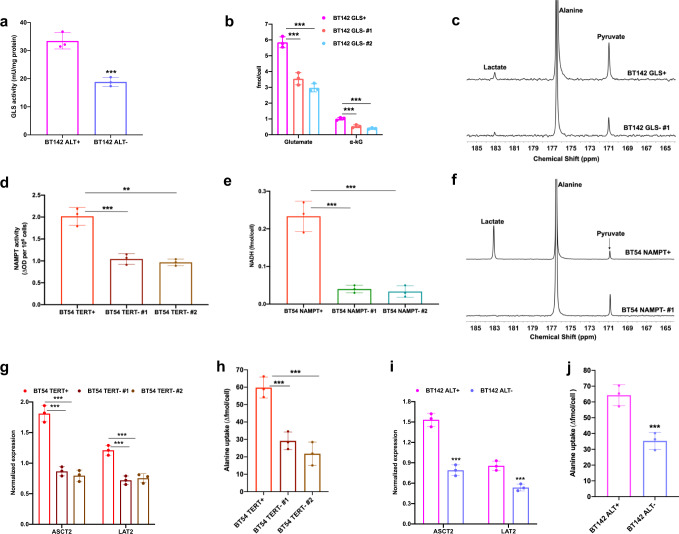
Fig. 8. GLS1, NAMPT, ASCT2, and LAT2 mechanistically link TERT expression and the ALT pathway to metabolic reprogramming in patient-derived LGOG and LGA models.
a GLS activity in BT142 ALT+ (magenta circles) and BT142 ALT− (lavender circles) neurospheres. b Effect of GLS1 silencing on 1H-MRS-detectable levels of glutamate and α-KG in the BT142 model (BT142 GLS+ neurospheres: magenta circles; BT142 GLS− #1 neurospheres: orange circles; BT142 GLS− #2 neurospheres: cyan circles). GLS1 silencing was achieved using two independent, nonoverlapping siRNA sequences/pools. c Representative summed 13C spectra showing hyperpolarized [1-13C]-alanine metabolism in BT142 GLS+ and BT142 GLS− neurospheres. d NAMPT activity in BT54 TERT+ (red circles), BT54 TERT− #1 (dark brown circles), and BT54 TERT− #2 (light brown circles) neurospheres. TERT silencing was carried out using two independent, nonoverlapping siRNA sequences/pools. e NADH levels measured by spectrophotometry in BT54 NAMPT+ (red circles), BT54 NAMPT− #1 (green circles), and BT54 NAMPT− #2 (teal circles) neurospheres. NAMPT silencing was achieved using two independent, nonoverlapping siRNA sequences/pools. f Representative summed 13C spectra showing hyperpolarized [1-13C]-alanine metabolism in BT54 NAMPT+ and BT54 NAMPT− neurospheres. g Expression of ASCT2 and LAT2 in BT54 TERT+ (red circles), BT54 TERT− #1 (dark brown circles), and BT54 TERT− #2 (light brown circles). TERT was silenced using two independent, nonoverlapping siRNA sequences/pools. h Effect of TERT silencing on intracellular import of [1-13C]-alanine as measured by thermally-polarized 13C-MRS in BT54 TERT+ (red circles), BT54 TERT− #1 (dark brown circles), and BT54 TERT− #2 (light brown circles). (i) ASCT2 and LAT2 expression in BT142 ALT+ (magenta circles) and BT142 ALT− (lavender circles) neurospheres. j [1-13C]-alanine import as measured by thermally polarized 13C-MRS in BT142 ALT+ (magenta circles) and ALT− (lavender circles) neurospheres. All experiments were performed on three biological replicates (n = 3). Results are presented as mean ± standard deviation. Statistical significance was assessed using an unpaired Student’s t test assuming unequal variance with p < 0.05 considered significant. *** represents statistical significance with p < 0.005. ** represents statistical significance with p < 0.01. Also, see Supplementary Fig. 6. Source data with exact p values are provided as a source data file.

