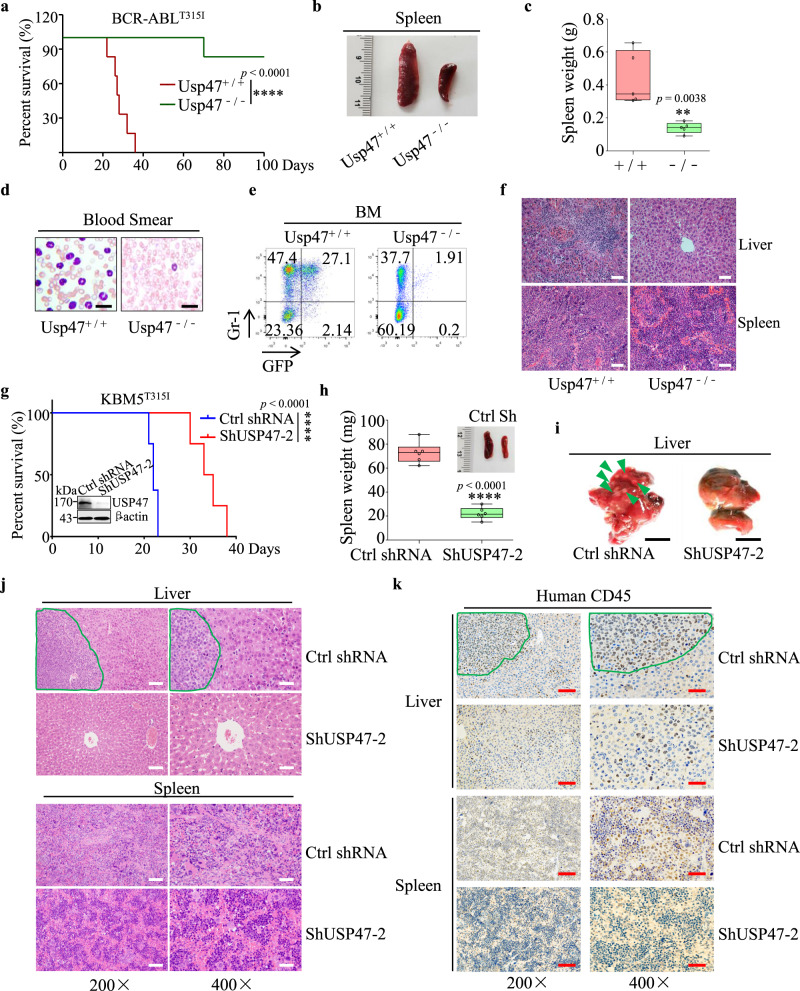
Fig. 4. Silence of Usp47 inhibits BCR-ABLT315I-induced CML and inhibits proliferation of KBMT315I in a xenograft model.
a Survival of mice after the transplantation of BCR-ABLT315I-transduced Usp47+/+ or Usp47−/− BM cells (n = 6 biologically independent samples per group). ****p < 0.0001, p-value was analyzed by Mantel-Cox-log-rank test. The experiment was repeated three times. b, c Size (b) and weight (c) of the spleen in the two groups of mice (n = 5 biologically independent samples per group) at 28 days after transplantation. Center lines of the box and whisker plot represent median values, whereas the box edges indicate the 25th and 75th centiles, and the whiskers indicate the minimum and maximum values. d, e At 28 days after transplantation, the morphology of cells from PB (d) was examined by Wright-Giemsa staining; the percentages of GFP+ and Gr-1+ cells (e) in BM were examined by FACS analysis. f H&E staining of the liver and spleen at 28 days after transplantation. Scale bars, 50 μm. g Ctrl shRNA or ShUSP47-2 transfected KBM5T315I cells (n = 8 biologically independent samples per group) were injected into B-NDG mice through the tail vein. ****p < 0.0001, p-value was analyzed by Mantel-Cox-log-rank test. h Size and weight of spleen at day 21 (n = 6 biologically independent samples per group). Center lines of the box and whisker plot represent median values, whereas the box edges indicate the 25th and 75th centiles, and the whiskers indicate the minimum and maximum values. i Infiltration of leukemia cells in the livers of the mice from Fig. 4h. Green arrows indicate infiltrated leukemic cells. Scale bars, 1 cm. j H&E staining of liver and spleen from mice bearing leukemia. Scale bars, 200 × , 100 μm; 400 × , 50 μm. k Immunohistochemical staining with human CD45 antibody in the liver and spleen shown in Fig. 4j. Scale bars, 200 × , 100 μm; 400 × , 50 μm. Data are mean ± s.d. p-values were analyzed by two-sided Student’s t-test (c, h) or Mantel-Cox-log-rank test (a, g). **p < 0.01; ****p < 0.0001. Source data are provided as a Source Data file.

