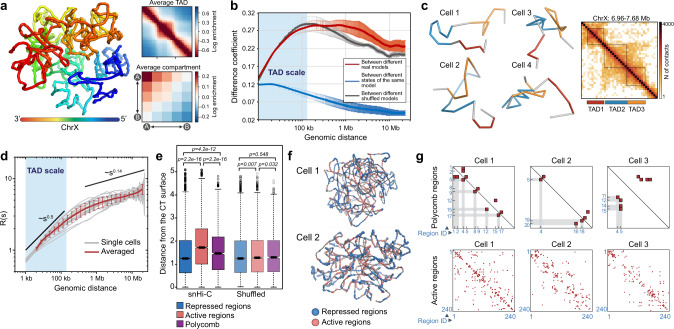
Fig. 5. 3D folding of the haploid X chromosome.
a Left panel: 3D structure of the haploid X chromosome from an individual nucleus derived from snHi-C data by the DPD polymer simulations. Right panel: averaging of contacts in the 3D model over TAD positions in the corresponding snHi-C data (top) and compartment (bottom) positions annotated in the bulk BG3 in situ Hi-C data. Source data are provided as a Source data file. b Coefficient of difference over a broad range of genomic distances. The central curves represent average values. Error bars show standard deviation (SD) for 20 independent model realizations, n = 2242 distinct ranges of genomic distances used for the curve construction. c Single-nucleus 3D structures of a genomic region covered by three TADs (left). Right, bulk BG3 in situ Hi-C map of this region. TAD positions are shown by colored rectangles below the map and by black squares on the map. d Dependence of the Euclidean spatial inter-particle distance R (see “Methods”) on the genomic distance s between these particles along the chromatin fiber. Black lines show the slopes characteristic for the random walk behavior (s0.5) and the crumpled globule build-up from Gaussian blobs (s0.14). Error bars show standard deviation (SD) for 20 independent model realizations, n = 20. e Spatial distance from the surface of a chromosome territory (CT) to transcriptionally active (n = 8966) and inactive (n = 17,103; according to RNA-seq from ref. 24) regions, and Polycomb-bound domains (n = 2160; according to the 9-state chromatin type annotation54). Boxplots show data aggregated from all individual models analyzed. Boxplots represent the median, interquartile range, maximum and minimum. P-values are calculated using the Mann–Whitney two-sided test. f Examples of simulated ChrX 3D structures demonstrating the preferential location of transcriptionally inactive regions (blue particles) at the surface of the CT. g Heatmap showing cell-to-cell variability in interactions detected between Polycomb domains (upper panels) or between transcriptionally active regions (bottom panels) in individual cells. Red rectangles denote detected interactions. The total number of Polycomb and active regions identified in the X chromosome are 20 and 240, respectively (see “Methods”). Only interacting domains are numbered for Polycomb domains; interacting active regions are not numbered due to their multiplicity.

