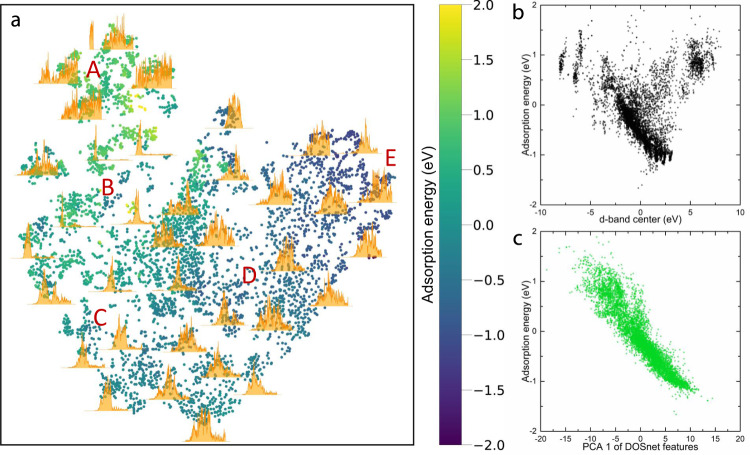
Fig. 5. Visualization of DOS feature space and correlation to adsorption energy.
a t-SNE plot of DOS features obtained from the last convolutional layer of DOSnet for the case of hydrogen adsorption. Points represent unique surface sites and are colored by the adsorption energy of that site. Selected DOS from these sites are plotted. b Plot of d-band center versus hydrogen adsorption energy. c Plot of the first component of the DOS features from a principal component analysis versus hydrogen adsorption energy.

