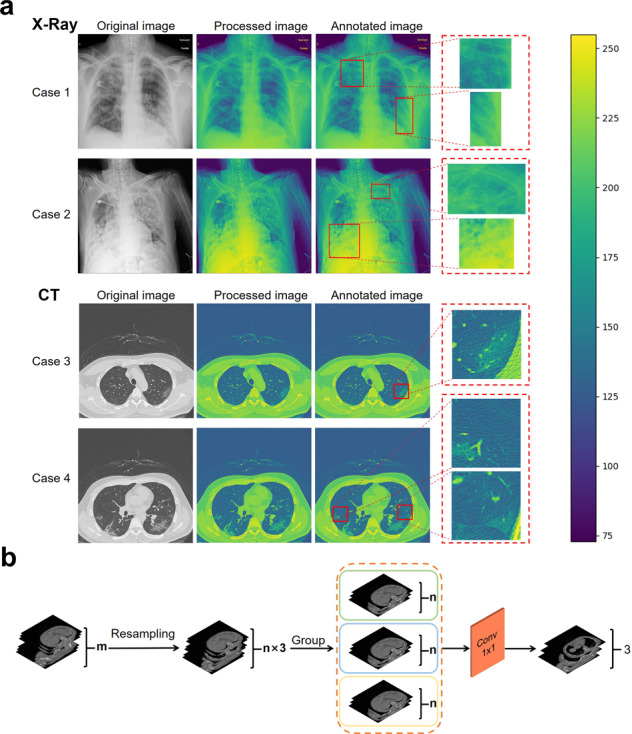
Fig. 1. Demonstrations of data preprocessing methods including pseudo-coloring and dimension normalization.

a Pseudo-coloring for abnormal examples in the CXR and CT images. The original grayscale images were transformed into color images using the pseudo-coloring method and were annotated by the experts. The scale bar on the right is the range of pixel values of the image data. b Dimension normalization to reduce the dimensions in the CT images. The number of CT images were first resampled to a multiple of three and then divided into three groups. Followed by the 1 × 1 convolution layers to reduce the dimensions of the data.
