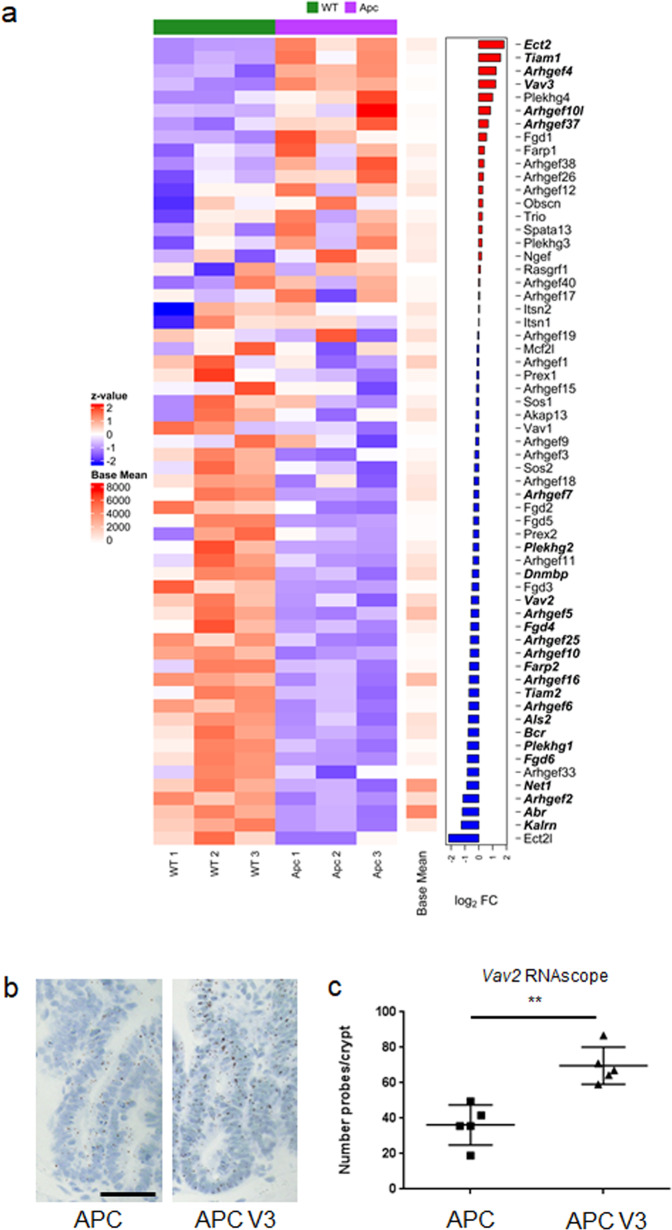
Fig. 2. VAV3 and TIAM1 are upregulated following APC loss.
a Heatmap derived from RNA-seq analysis comparing whole tissue from wild-type (Vil-CreERT2) and APC intestines (Vil-CreERT2 Apcfl/fl) n = 3 biologically independent animals for both APC and WT intestinal tissue. Log2FC of GEF expression displayed on the right, genes significantly deregulated displayed in bold (FDR < 0.05) displayed in bold. b RNAscope of Vav2 in the intestinal epithelium of Vil-CreERT2 Apcfl/fl (APC) and Vil-CreERT2 Apcfl/fl, Vav3−/− (APC V3) mice, Scale bar represents 100 μm. c Quantification of Vav2 RNAscope from Vil-CreERT2 Apcfl/fl and Vil-CreERT2 Apcfl/fl Vav3−/− intestines. N = 5 biologically independent animals for each genotype. P = 0.0079 as determined by a two-tailed Mann–Whitney test. Data are presented as mean values ±SD.

