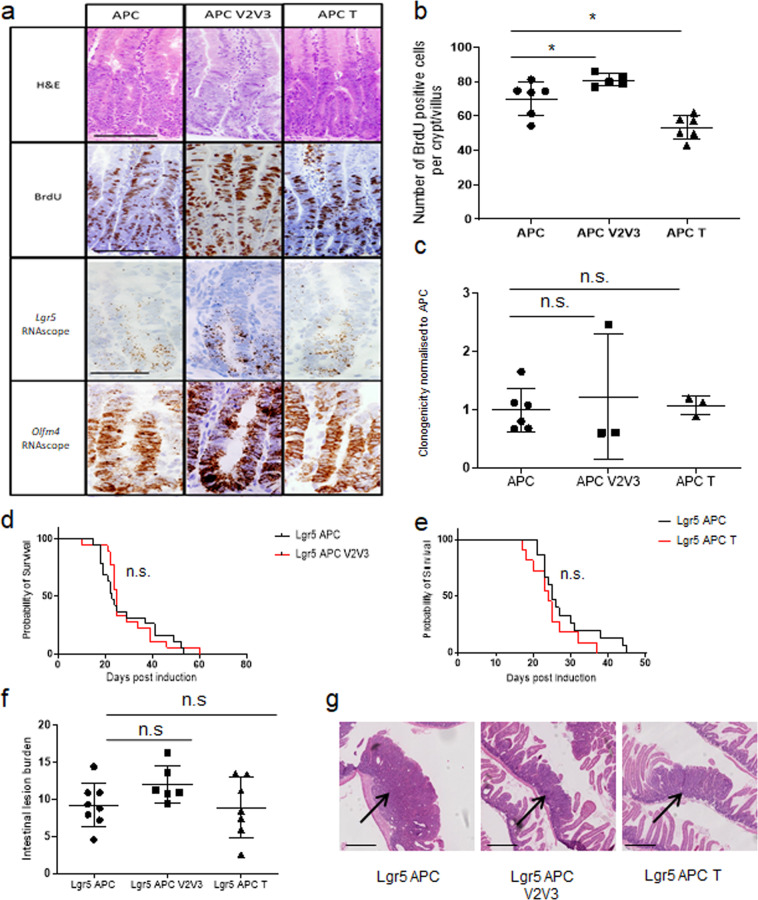
Fig. 3. Loss of a single or double GEF is unable to rescue the Apcfl/fl phenotype.
a H&E, BrdU incorporation and RNAscope for Lgr5 and Olfm4 on Vil-CreERT2 Apcfl/fl (APC), Vil-CreERT2 Apcfl/fl, Vav2−/−, Vav3−/− (APC V2V3) and Vil-CreERT2 Apcfl/fl Tiam1−/− (APC T). Scale bar represents 100 μm for H&E and BrdU and 50 μm for RNAscope images. b Quantification of BrdU positive cells. N = 6, 5 and 6 biologically independent animals for Vil-CreERT2 Apcfl/fl (APC), Vil-CreERT2 Apcfl/fl, Vav2−/−, Vav3−/− (APC V2V3; p = 0. 0303 as determined by a two-tailed Mann–Whitney) and Vil-CreERT2 Apcfl/fl Tiam1−/− (APC T; *p = 0.0260, as determined by a two-tailed Mann–Whitney) respectively. Data are presented as mean values ±SD. c Quantification of clonogenicity assay of intestinal organoids. N = 6, 3 and 3 biologically independent animals for Vil-CreERT2 Apcfl/fl (APC), Vil-CreERT2 Apcfl/fl, Vav2−/−, Vav3−/− (APC V2V3; p = 0.5476, as determined by a two-tailed Mann–Whitney) and Vil-CreERT2 Apcfl/fl Tiam1−/− (APC T) respectively (p = 0.5476, as determined by a two-tailed Mann–Whitney). Data are presented as mean values ±SD. d, e Survival of Lgr5-EGFP-IRES-creERT2 Apcfl/fl (Lgr5 APC), Lgr5-EGFP-IRES-creERT2 Apcfl/fl Vav2−/−, Vav3−/− (Lgr5 APC V2V3) and Lgr5-EGFP-IRES-creERT2 Apcfl/fl Tiam1−/− (Lgr5 APC T). d N = 19 and 18 biologically independent animals for Lgr5 APC and Lgr5 APC V2V3 respectively (p = 0.7142, as determined by Log-rank (Mantel-Cox) test). e N = 15 and 10 biologically independent animals for Lgr5 APC and Lgr5 APC T respectively (under the control of Lgr5-EGFP-IRES-creERT2). (p = 0.1982, as determined by Log-rank (Two-tailed Mantel-Cox test). The same Lgr5 APC control cohort was used in both d and e as well as in Fig. 4f and Supplementary Fig. 6D. f Quantification of intestinal tumour burden following APC loss in the Lgr5 stem cell compartment. Tumour burden is determined as percentage of intestine which is covered by lesion or adenomas. Lgr5-EGFP-IRES-creERT2 Apcfl/fl (APC; n = 9 biologically independent animals) vs Lgr5-EGFP-IRES-creERT2 Apcfl/fl Vav2−/−, Vav3−/− (APC V2V3; n = 6 biologically independent animals) p = >0.9999 as determined by a two-tailed Kruskal–Wallis with Dunn’s multiple comparisons test. Lgr5-EGFP-IRES-creERT2 Apcfl/fl (APC) vs Lgr5-EGFP-IRES-creERT2 Apcfl/fl Tiam1−/− (APC T; n = 7 biologically independent animals), p = 0.7532 as determined by a two-tailed Kruskal–Wallis with Dunn’s multiple comparisons test. Data are presented as mean values ±SD. g Solid adenomas (H&E) were observed in each genotype, indicated by the arrow. Scale bar represents 500 μm.

