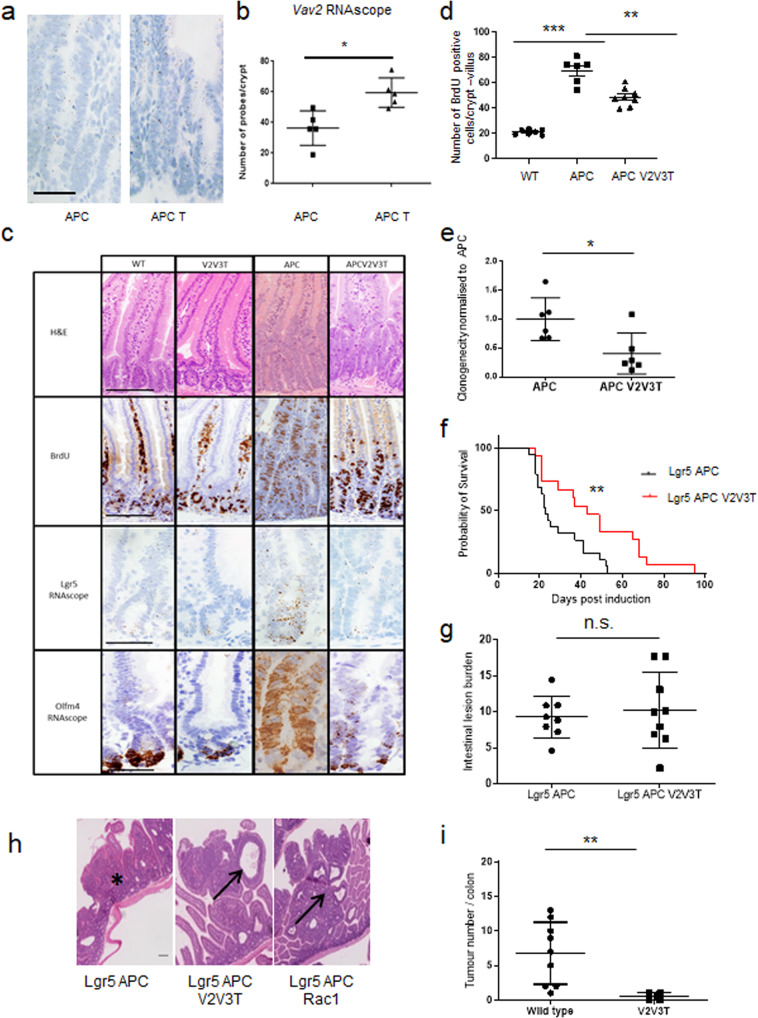
Fig. 4. Loss of three GEFs is able to suppress the loss of Apc phenotype.
a RNAscope staining for Vav2 in intestine from Vil-CreERT2 Apcfl/fl (APC) and Vil-CreERT2 Apcfl/fl Tiam1−/− (APC T) intestines. Scale bar represents 100 μm. b Quantification of Vav2 RNAscope in Vil-CreERT2 Apcfl/fl (APC) and Vil-CreERT2 Apcfl/fl Tiam1−/− (APC T) intestines. N = 5 biologically independent animals for each genotype *p = 0.0159 as determined by a two-tailed Mann–Whitney test. Data are presented as mean values ±SD. c Images for H&E and BrdU incorporation and RNAscope for Lgr5 and Olfm4 on wild-type (WT), Vav2−/−, Vav3−/ Tiam1−/− (V2V3T), Vil-CreERT2 Apcfl/fl (APC) and Vil-CreERT2 Apcfl/fl, Vav2−/− and Vav3−/−Tiam1−/− (APC V2V3T). Scale bar represents 100 μm for H&E and BrdU and 50 μm for RNAscope images. d Quantification of BrdU positive cells. N = 7, 6 and 8 biologically independent animals for wild-type, Vil-CreERT2 Apcfl/fl (APC) and Vil-CreERT2 Apcfl/fl, Vav2−/− and Vav3−/− Tiam1−/− (APC V2V3T) respectively. WT vs APC ***p = 0.0006, APC vs APC V2V3T *p = 0.0013 as determined by a one-tailed Mann–Whitney test. Control data (APC) as in Fig. 3c. Data are presented as mean values ±SD. e Quantification of clonogenicity assay of intestinal organoids. N = 6 biologically independent cell lines for both Vil-CreERT2 Apcfl/fl (APC) and Vil-CreERT2 Apcfl/fl, Vav2−/−, Vav3−/− Tiam1−/− (APC V2V3T). *p = 0.0260 as determined by a two-tailed Mann–Whitney test. f Compared to Lgr5-EGFP-IRES-creERT2 Apcfl/fl (Lgr5 APC), Lgr5-EGFP-IRES-creERT2 Apcfl/fl Vav2−/−, Vav3−/− Tiam1−/− (Lgr5 APC V2V3T) mice have a significant survival advantage. N = 19 and 15 biologically independent animals for Lgr5 APC and Lgr5 APC V2V3T respectively. **p = 0.0091 as determined by a two-tailed Log-rank (Mantel-Cox) test. Lgr5 APC control cohort is the same cohort as used in Fig. 3d, e as well as Supplementary Fig. 6D. Data are presented as mean values ±SD. g Quantification of intestinal tumour burden at clinical endpoint following APC loss in the Lgr5 stem cell compartment. N = 8 and 9 biologically independent animals for Lgr5-EGFP-IRES-creERT2 Apcfl/fl (Lgr5 APC) and Lgr5-EGFP-IRES-creERT2 Apcfl/fl Vav2−/−, Vav3−/− Tiam1−/− (Lgr5 APC V2V3T) respectively. p = 0.9522 as determined by a two-tailed Mann–Whitney test. Data are presented as mean values ±SD. h Solid adenomas (asterisk) were observed in the Lgr5-EGFP-IRES-creERT2 Apcfl/fl (Lgr5 APC) cohort, whereas cystic adenomas were observed (H&E) in Lgr5-EGFP-IRES-creERT2 Apcfl/fl Vav2−/−, Vav3−/− Tiam1−/− (Lgr5 APC V2V3T) and Lgr5-EGFP-IRES-creERT2 Apcfl/fl, Rac1fl/fl (Lgr5 APC Rac1), as indicated by arrows. Scale bar represents 100 μm. i Intestinal tumour number in an AOM-DSS colitis-associated model of tumourigenesis. Study was carried out on wild-type mice or Vav2−/−, Vav3−/− Tiam1−/− mice. N = 9 and 4 biologically independent animals for wild-type or Vav2−/−, Vav3−/− Tiam1−/− respectively. **p = 0.0042 as determined by a one-tailed Mann–Whitney Test. Data are presented as mean values ±SD.

