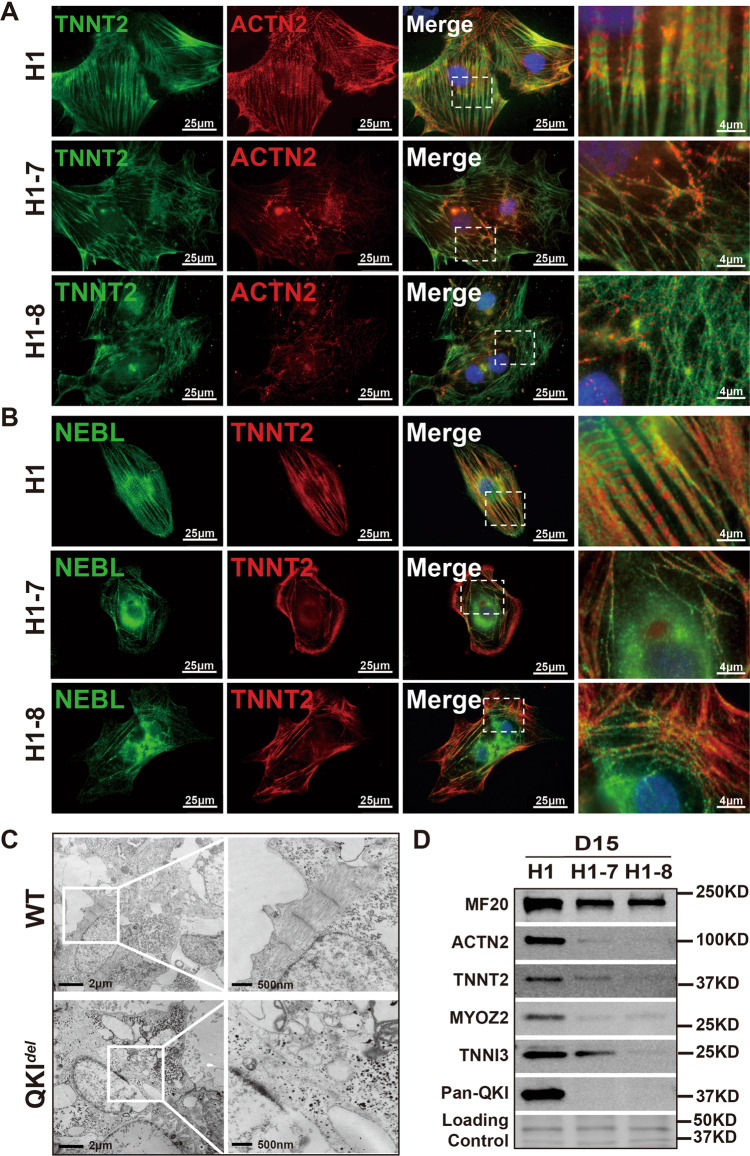
Fig. 7. Severely altered myofibrillogenesis in hESCs-QKIdel-derived cardiomyocytes.
A Representative images of immunofluorescence staining of TNNT2 (green) and ACTN2 (red) in H1, H1-7, and H1-8 cardiomyocytes at differentiation Day-15. Scale bar: 25 μm. B Representative images of immunofluorescence staining of TNNT2 (red) and NEBL (green) in H1, H1-7, and H1-8 cardiomyocytes at differentiation Day-15. Scale bar: 25 μm. C Representative transmission electron microscopy images of normal and QKI-deficient differentiated cardiomyocytes at Day-15. Scale bar: 2 μm and 500 nm, respectively. D Western blot analysis of key myofibrillar proteins in control H1 and mutant H1-7 and H1-8 cardiomyocytes (Day-15). All experiments are independently repeated three times with three different sets of cell samples to ensure the reproducibility of the findings.

