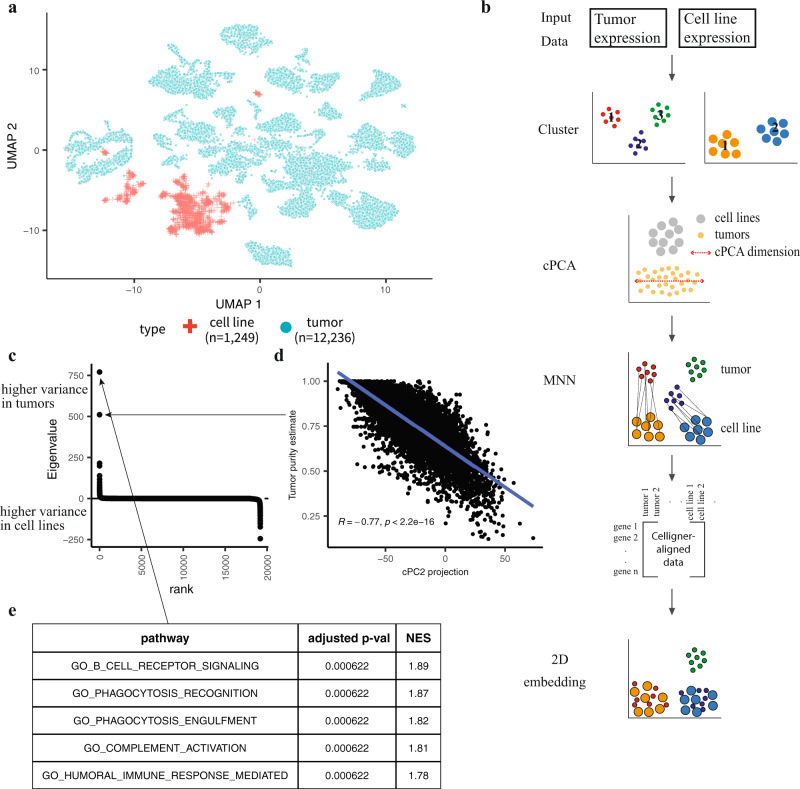
Fig. 1. Overview of the Celligner alignment method.
a A 2D projection of combined, uncorrected cell line and tumor expression data using UMAP (n = 1,249 cell lines, n = 12,236 tumors). b Method: Celligner takes cell line and tumor gene expression data as input, and first identifies and removes expression signatures with excess intra-cluster variance in the tumor compared to cell line data using contrastive Principal Component Analysis (cPCA). Then Celligner identifies and aligns similar tumor-cell line pairs to produce corrected gene expression data, using mutual nearest neighbors (MNN) batch correction, which allows for improved comparison of tumors and cell lines. c cPC eigenvalues ordered by rank (n = 19,188 eigenvalues). d Pearson correlation between the projection of tumor samples onto cPC2 and their estimated purity (using a consensus measurement of tumor purity28) (n = 7,832 tumors). e The top five pathways from gene set enrichment analysis (GSEA) of cPC1. P-values are based on a gene-permutation test and adjusted using the Benjamini-Hochberg procedure (Methods, ‘Gene set enrichment analysis’).

