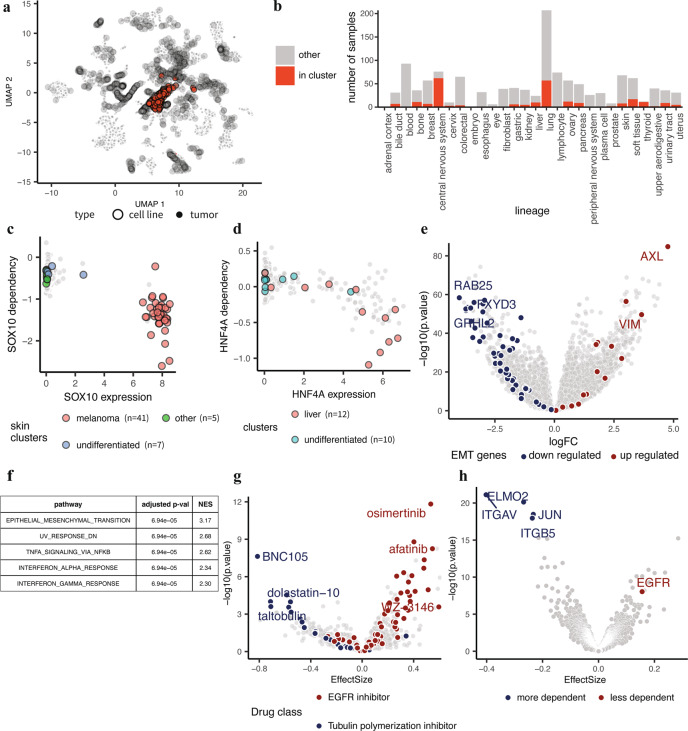
Fig. 5. A cluster of cell lines show EMT signature and integrin-related dependencies.
a A cluster of 252 undifferentiated cell lines within the global Celligner-alignment. b Composition of the cell lines within the cluster (n = 252 cell lines). c Skin cell lines within the cluster do not express and do not depend on SOX10. d Liver cell lines within the cluster have lower expression of, and weaker dependency on, HNF4A. e Differential expression analysis shows an up-regulated mesenchymal profile and f enrichment of the EMT pathway for cell lines in the cluster. P-values are based on a gene-permutation test and adjusted using the Benjamini-Hochberg procedure (Methods, ‘Gene set enrichment analysis’). g Differential drug vulnerability analysis shows decreased sensitivity to EGFR inhibitors and increased sensitivity to tubulin polymerization inhibitors for cell lines in the cluster. h Differential dependency analysis shows stronger integrin-related dependencies for cell lines within the cluster.

