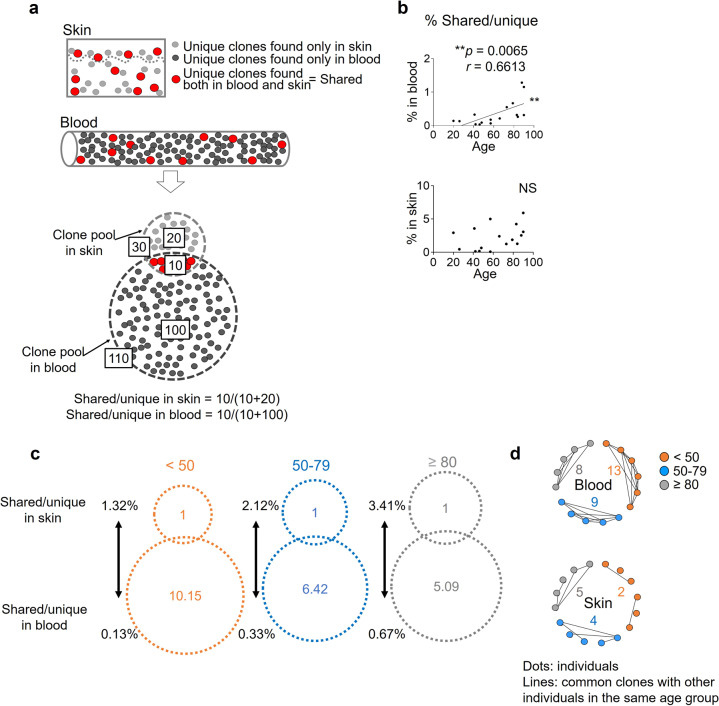
Fig. 4. The skin T-cell pool is better maintained than the blood T-cell pool.
a Illustration of the unique TCR clones (unique) in the blood (black) and the skin (gray) and the shared TCRs found both in the blood and in the skin (shared, red) of the same individual. In this example, shared/unique is 10/30 in the skin and 10/110 in the blood. b Frequency of shared clones per unique clones between the blood and the skin. The two-tailed Spearman rank correlation coefficients were performed. NS not significant, **p < 0.01. c The relative sizes of the unique clone pools in the skin and the blood were estimated by the average numbers of the shared clones and the % shared/unique in the skin and blood of the 3 age groups. d Common clones in the different participants of each age group. NS not significant, **p < 0.01.

